


Editor’s note: This presentation was given by Moriba Jah at Connections: Accelerating Innovation with Graphs in August 2021.
My name is Moriba Jah, and I am an associate professor of aerospace engineering and engineering mechanics at the University of Texas at Austin, where I lead a transdisciplinary research program in space safety, security, and sustainability. With this blog, I am excited to talk about ASTRIAGraph and our very unique use of Neo4j to solve WICKED SPACE PROBLEMS!
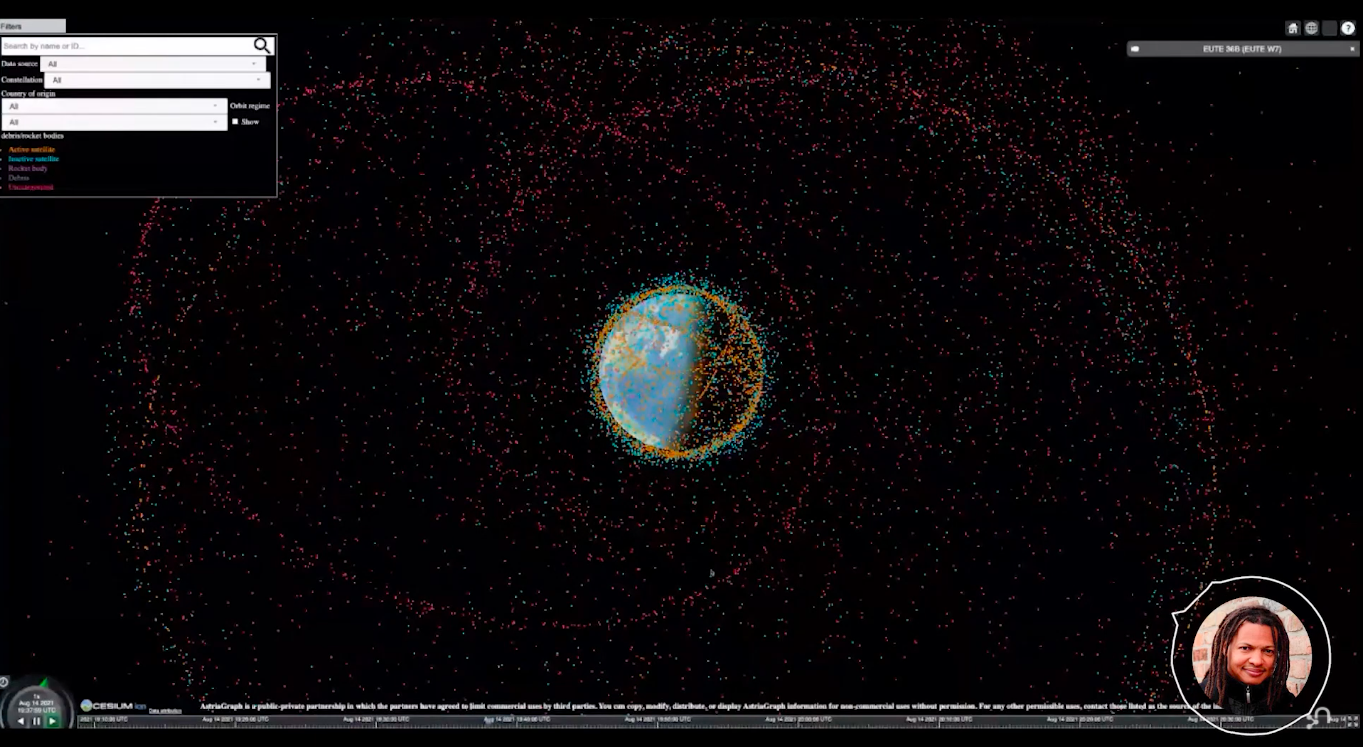
Let’s begin by taking a look at this graphic below. What you should be able to see is the Earth with a bunch of dots. Now, every one of these dots is something that humans are responsible for putting into space. I know, it seems like a lot of stuff. Well, that’s because it is a lot of stuff.
Tracking 26,000 Objects in Space
Back in 1957, we, as a humanity, launched Sputnik. It was a satellite in what’s called low Earth orbit, just a few hundred kilometers above the Earth’s surface. It didn’t last that long in orbit. It ended up re-entering and burning up in the Earth’s atmosphere.
Think about this: In 1957, we launched the first object into space, and now it’s 2022. We are tracking upwards of 26,000 objects in space ranging in size from a cell phone all the way up to the space station. I call these anthropogenic space objects. Anthropogenic means human-based or human-derived.
Instead of just having a couple of countries launching these objects, we now have upwards of 90 countries that are considered spacefaring nations, that in one way or another, own or operate objects in space.
These 26,000 anthropogenic space objects don’t all work. Unfortunately, only about 3,500 to 4,000 of those objects are working and providing some sort of service like position navigation or timing with global navigation satellite systems, such as communication satellites or DirecTV. Even weather satellites provide warnings of hurricanes and monitor the Earth for climate change. Now we have companies launching satellites to provide internet. So we have a plethora of types of satellites in Earth’s orbit, and only about 4,000 of these objects are actually working. The rest of these “things” are garbage.
The color scheme shows orange as the only things that actually work and everything else is something that is dead, meaning they’re pieces of debris. Basically, satellites age in space, and unless they are in really low Earth orbit, they’re going to be up there for a long time.
Example: Starlink2060
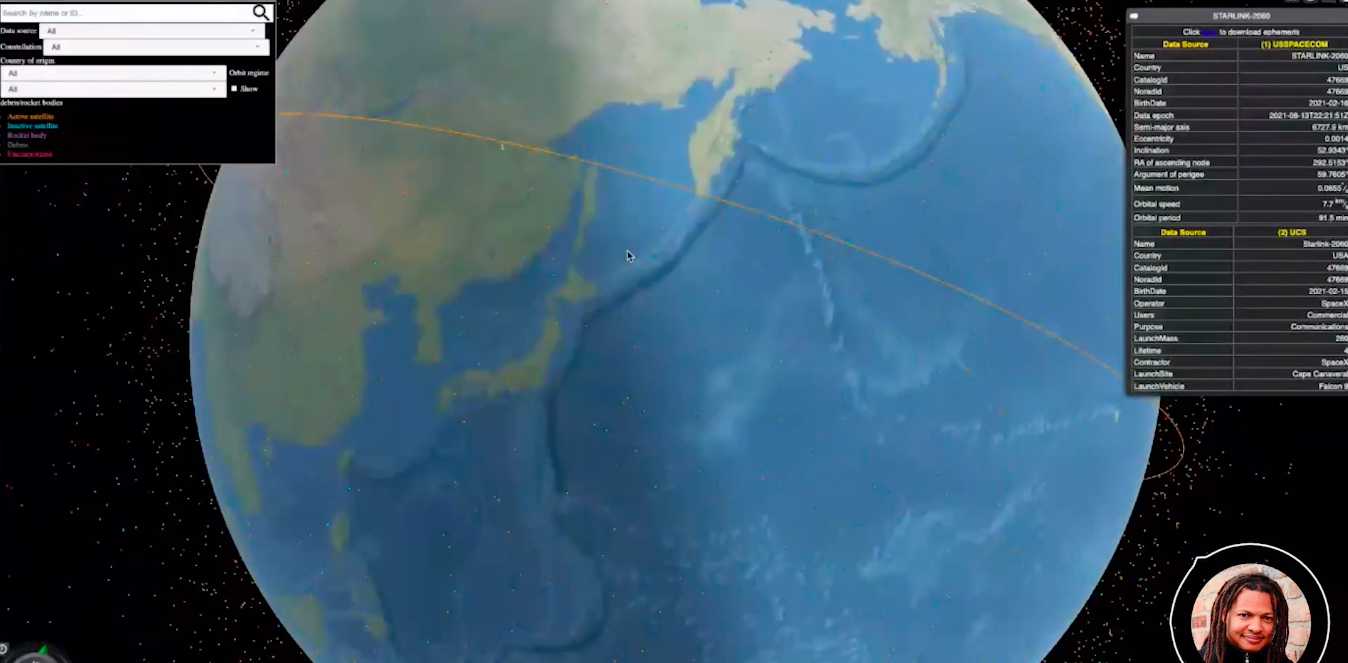
In this image above, I am zoomed into the Earth and have clicked onto a particular dot that represents a satellite. It actually belongs to SpaceX and is Starlink2060, which is its designator or name. You can see the orbit trajectory of this satellite, which is at an altitude roughly a few hundred kilometers above the Earth’s surface, so this is called lower orbit.
At some point, that satellite is going to stop working, and whenever that point comes, then it will be up to Mother Nature to clean that thing up. Meaning, because it’s in a sufficiently low Earth orbit, atmospheric friction from particles in the upper atmosphere will slow it down. It’s just like when you’re driving your car and you put your hand out of the window and feel that air resistance. You don’t have air in space, but you have particles that are part of the upper atmosphere that will slow these things down and when they hopefully re-enter, burn up during re-entry.
Example: High Altitude Satellites

Then you have satellites that are at higher altitudes, which are going to pretty much be up there forever. I zoomed out a bit for this image of a satellite belonging to France that looks like a communication satellite. This is what’s called the geostationary ring when you put a satellite at this orbital altitude. It takes about 24 hours to go around its orbit once, and that’s about a solar day, as you know. That way it stays relatively fixed in the sky over a certain part of the Earth.
This geostationary or geosynchronous highway is becoming polluted with stuff. You can see lots of non-orange things, and all of that stuff is basically garbage. In fact, we can take a look at that just by looking at different orbital regimes, like in this image below.
Looking at this orbital highway, you can see things that are tilted and then things that are on this line. The stuff that’s on the line, this orange layer, are all orbiting the Earth along Earth’s equatorial plane, or Earth’s equator. All the other stuff that’s tilted are dead objects. The reason they’re tilted is because of gravity from the moon and also the sun changes their orbit.
Challenge: Predicting and Preventing Collisions
You can see the trash. It’s like a landfill in space that is interacting with things that we care about. Part of the hazardous problem, from an orbital safety perspective, is in trying to predict when any one of these pieces of junk could collide with something that we care about and wipe out that satellite service or capability that we depend upon.
From a space sustainability perspective, just like with environmental protection of the land, oceans, and the air, we want to be able to protect Near-Earth space as an additional ecosystem so that we can enjoy utilizing it for many generations to come. We actually risk not being able to do that if we keep on launching things and don’t have a global way to not only track them, but come up with a set of norms of behavior where everybody can use this common resource so we can avoid polluting it even more. Basically, we want to flatten the curve on the proliferation of space garbage.
Much like with COVID, the main reason why we’re not flattening the curve is because people are non-compliant with what science says. Groups of scientists around the globe have come up with a checklist of practices and protocols that would help flatten the curve on the spread of orbital debris, but we have a high degree of non-compliance with the science.
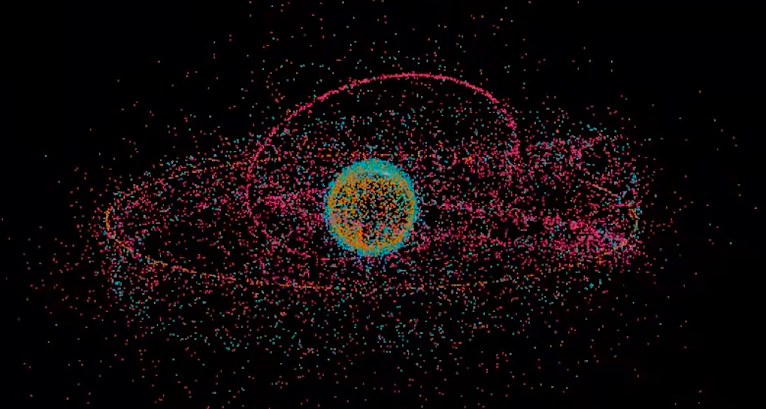
Then, from a space security perspective, you can imagine with all these countries interacting in this common environment, maybe there are behaviors that one country might do that makes another country feel threatened. With the US, China, Russia, maybe you’ve seen in the news that there are geopolitical trade winds that are also affecting the behavior and interaction of people and how they’re operating their objects in space. We definitely don’t need an arms race in outer space that leads to a conflict where people will just start blowing stuff up in space because, oh, by the way, when you blow something up in orbit, a lot of that stuff remains. I’ll show you a look at this in the image below.
Space Debris
One of the things that you can barely make out here in ASTRIAGraph, but I’ll talk about, is you the string of pearls of pink dots if you can see them. These pink dots, though we don’t quite know exactly what type of object they are, we do know that they are dead. All those pink dots came from what I call a super spreader event – one rocket body that apparently blew up. Once a large thing blows up, it becomes many, many small things – tens of thousands, if not hundreds of thousands of smaller pieces. When things die in space, it doesn’t mean that they cease to exist. Instead, they become traffic hazards to things that are working and that we care about.
This gives you an idea of the trackable population of anthropogenic space objects. I use the word trackable because we theorize that there are probably about half a million to a million objects if we go all the way down to the size of a speck of paint or a millimeter in diameter, and these small objects are also hazardous. Just as bullets can do a lot of damage because they’re traveling very quickly, small objects in space can do a lot of damage because they’re also traveling very quickly.
Conjunction Streaming Service
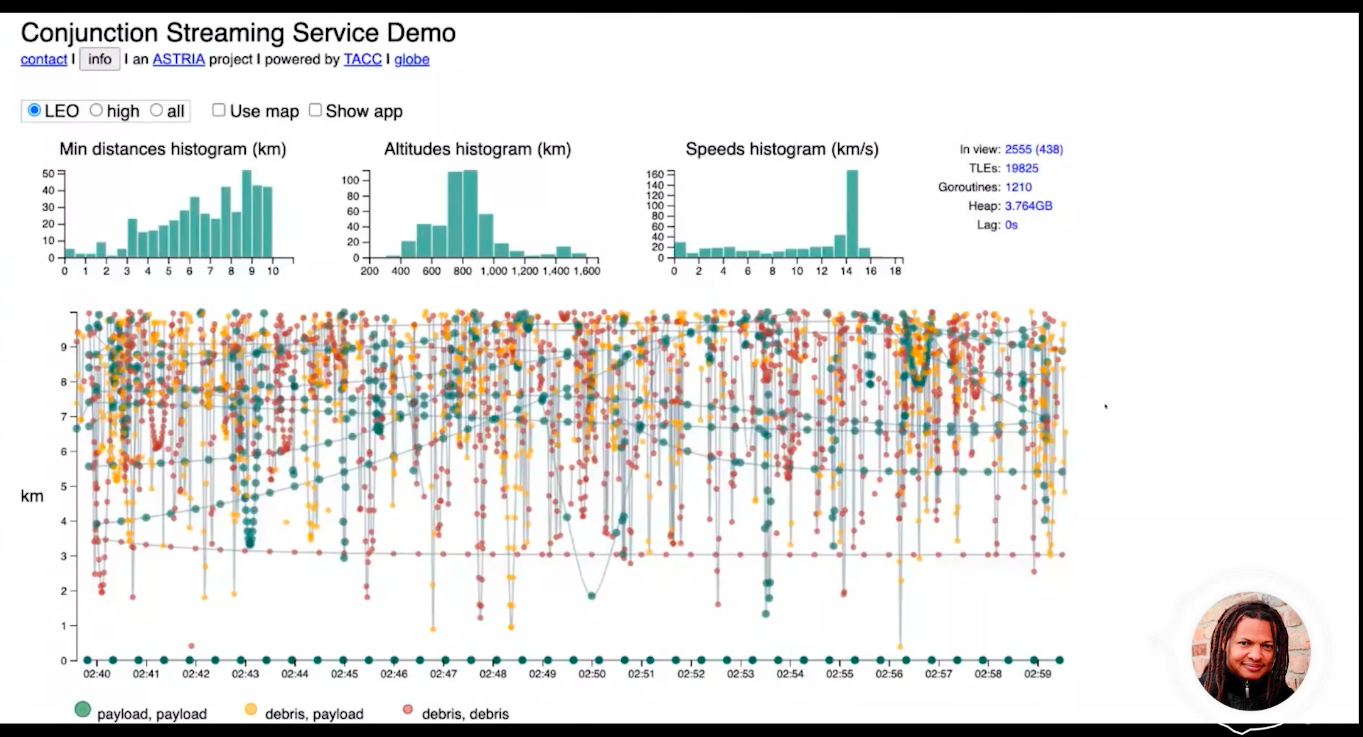
To put this in perspective, take a look at this conjunction streaming service that we’ve developed. Over a continuous 20 minutes, we’re comparing about 19,825 objects to each other and asking ourselves the following question: Over the next 20 minutes, can we predict which pair of objects will come within 10 kilometers or six miles of each other? So we have a continuously sliding window of these predictions or criss-crossings.
The dots that are red are for when both objects in that pair are dead or defunct. Yellow dots are when one is working and the other one is dead. Green are for when both of them are dead. The dots form histograms. Basically, you can see relative speeds between these objects peaking at about 15 kilometers per second, which is about 15 times the speed of a bullet. So even when small objects are going that fast, they can do a lot of damage. These conjunctions, which are close approaches, are not collisions. The traffic patterns are somewhat congested, and things are criss-crossing each other, but that doesn’t mean that they will collide, though there’s certainly a risk of collision.
ASTRIAGraph Knowledge Graph
At this point, you might be asking, “All right, how does all this matter when it comes to graph databases?” ASTRIAGraph leverages Neo4j. We use Neo4j to build this knowledge graph. Think of ASTRIAGraph as the world’s largest compendium of multi-source information about stuff in space, because we are trying to aggregate information from different countries, companies, other scientific researchers, amateur telescope astronomers, you name it. Wherever we can get information, we’re trying to build up this compendium of stuff in space and make it accessible to all of humanity. We’re trying to make space safer, more secure, and more sustainable.
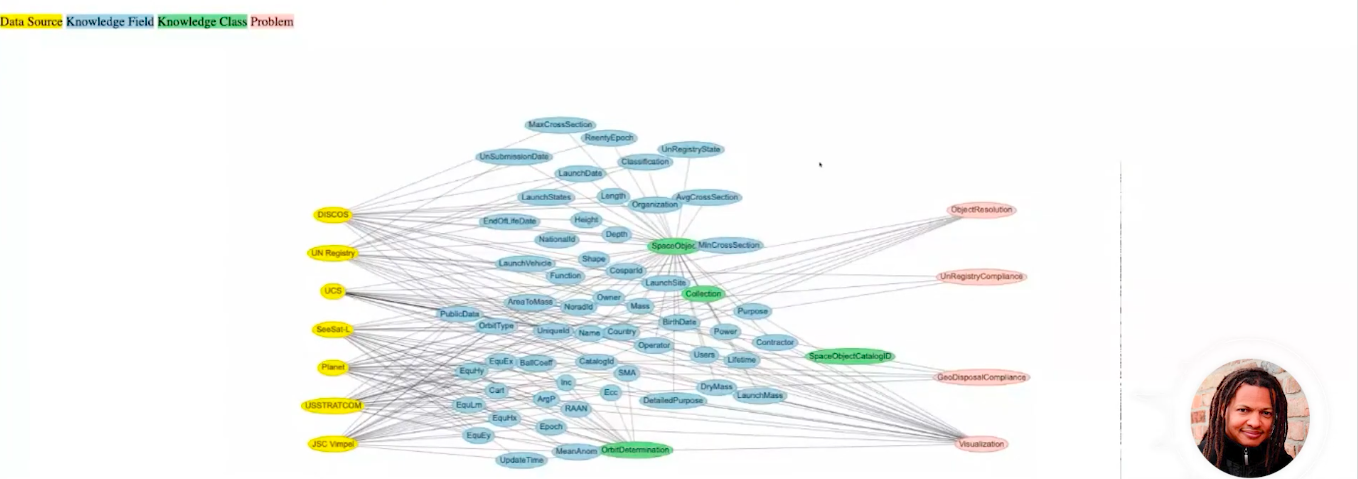
One of the really awesome things that we’ve been able to do, shown in the image above, is our data schema that uses Neo4j. This is a live schema, so whenever we update it, you can see the different entities and new elements. By clicking on any one of these bubbles, you can see what the connective tissue is within ASTRIAGraph to different problems. Problems are typically here on the right hand side, and we have data of sources on the left hand side. Then we have labeled relationships, which are part of the knowledge graph, that live in the middle.
Application Architecture: 3 Layers
The way that we actually implement ASTRIAGraph from a practical perspective is we have three layers, or a three tiered system.
Layer 1: Landing Zone
The bottom layer, or the ground floor, is what we call our landing zone. The landing zone is where we try to bring in sources of information, whether it’s from government, industry, academics, or citizens.
Layer 2: Mezzanine – Neo4j Knowledge Graph
The middle layer, the mezzanine, is Neo4j. We develop interpreters of the sources of information, the instance data, and map information from these sources into the knowledge graph database, so ASTRIAGraph in Neo4j.
Layer 3: Inquiry Layer
The top layer are applications and inquiries from people that have questions. You can think of it as the problem layer. For instance, the United Nations has asked us to assess and quantify how people are actually implementing or interpreting the UN convention on space object registration, monitoring for compliance or non-compliance with different rules, laws, or regulations.
So, the actual inquiry is the top layer that gets to query ASTRIAGraph, and we’re able to do a variety of analyses to satisfy very different types of inquiry. ASTRIAGraph is a very exciting application of Neo4j, and many people from around the globe have found great utility in being able to use this so far.
Example: Telescope Tracking
In this image, we have three telescopes that are part of my research program Astronet, also leveraging ASTRIAGraph. What you can see here are these lines, and each one of these lines basically says this object is tracked by this telescope that we have in, say, Australia for instance. From these lines, you can see the orbital altitudes where we’re actually collecting data from the telescopes. I don’t have telescopes everywhere, just three for now in Australia, New Mexico, and Chile, but I’m looking to grow Astronet.
Astronet leverages information that we are able to house within ASTRIAGraph, so the sensors can actually query the knowledge graph to help determine what things they need to track and when.
Example: Fingerprinting Objects in Space

Here, for instance, is a model of a dead satellite called TOPEX that we’re trying to do analysis on. All these dots are data that we’ve collected with a photon counter, which counts reflected packets of light or particles of light being reflected off of TOPEX. I included the CAD model as context, but this is also information that we can model and curate within ASTRIAGraph. So at any given point in time, when we want to take more observations of TOPEX, we can have all these data that are time tagged and associated with unique identities of objects.
Redder, or more red, means that we had a larger number of photons coming from that part of the spacecraft. Redder also means reflection. This is sunlight reflecting off of TOPEX, so redder means that we have more mirror-like reflections versus green or blue, which are more diffused types of reflections.
What’s Next?
We’re trying to actually develop the world’s first “fingerprinting technology” to remotely fingerprint objects to see if we can use that fingerprint as a biometrically inspired space object recognition system. We’re leveraging Neo4j and ASTRIAGraph to help us model and curate this scientific activity as well.
I hope my blog gives you an idea of what space safety, security, and sustainability entails. ASTRIAGraph, supported by Neo4j, is helping us to model these “dead” satellites and debris in space that pose serious hazards. Flattening the curve on the proliferation of space garbage is challenging, for the reasons I explained, including object collisions, geopolitics, and science non-compliance. The goal for me is full transparency in space – that nothing hides in space and everyone knows where everything is at all times.
Get the White Paper


