Neo4j Bloom User Interface Guide
|
Important - page not maintained
This page is no longer being maintained and its content may be out of date. For the latest guidance, please visit the Getting Started Manual . |
This article shows how to use Neo4j Bloom for exploring graph data in Neo4j.
It helps to have read the section on graph databases and Neo4j Desktop.
Beginner
Neo4j Bloom is a data exploration tool that visualizes data in the graph and allows users to navigate and query the data without any query language or programming.
Users can write patterns similar to natural language questions to retrieve data and traverse layers of the graph. Bloom also allows appropriate users to edit, update, or correct the graph when missing information or bad data is found.
Ways to use Neo4j Bloom
There are a couple of different ways to access and use Neo4j Bloom. These are outlined below.
-
Neo4j Bloom local with users accessing Bloom via Neo4j Desktop (free for local database instances)
-
Neo4j Bloom server with users accessing Bloom via a web browser
-
Neo4j Bloom through the sandbox
-
Neo4j Bloom through Neo4j Database as a Service, AuraDB
-
Included in Neo4j Startup Program
For this guide, we will focus on using Neo4j Bloom locally via Neo4j Desktop. Neo4j Bloom 1.3 onwards is available for free on Neo4j Desktop. No activiation key or download action is required.
Install Neo4j Bloom
If you do not yet have Neo4j Desktop, you can install it from our download page. Neo4j Bloom is part of the installation. You will need to have Neo4j Desktop version 1.2.7 or above. After installing, you will need to create a database instance. Detailed instructions for this are on the Neo4j Desktop guide.
As noted above, we will be working with a local version of Bloom from Neo4j Desktop.
The Neo4j Bloom application should show under the Graph Apps tab in Neo4j Desktop.
More information about Bloom in Desktop is in the documentation.
Our example data set
In this guide, we will walk through an example of exploring a retail data set to help us see what Bloom can provide and the functionality it supports. We will use the Northwind data, which is a fictional retail system of orders, products, and customers.
With Bloom, we will see how to navigate and explore the data to gather business value and insights.
To load this data, we can start our instance in Neo4j Desktop and open Neo4j Browser by going to localhost:7474 in a web browser.
Then, in the Cypher command bar, type :play northwind-graph and run it for the Browser guide to appear in a pane below the command line.
Click on and run the Cypher queries in the slides to load all of the Northwind data into the graph.
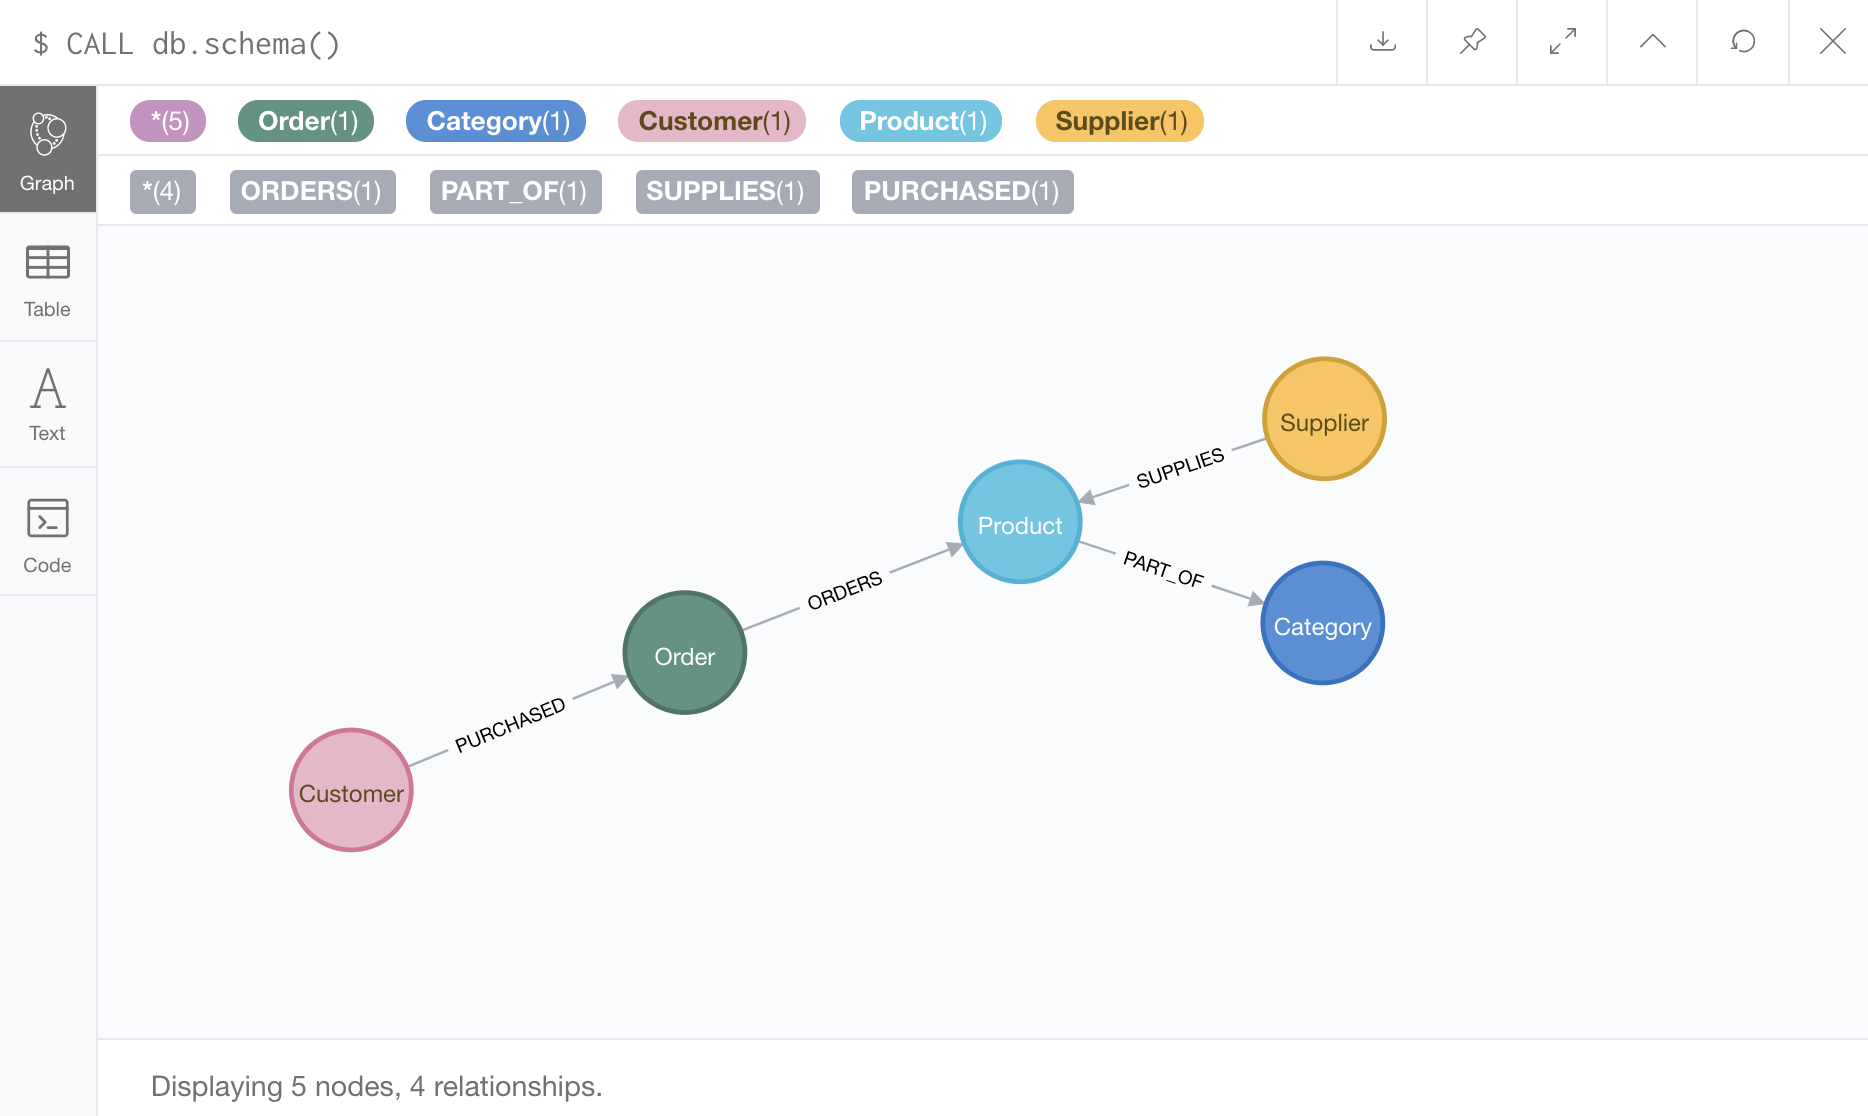
When finished, we can run CALL db.schema.visualization() in the command line, and the data model should match the one shown below.
Starting Bloom
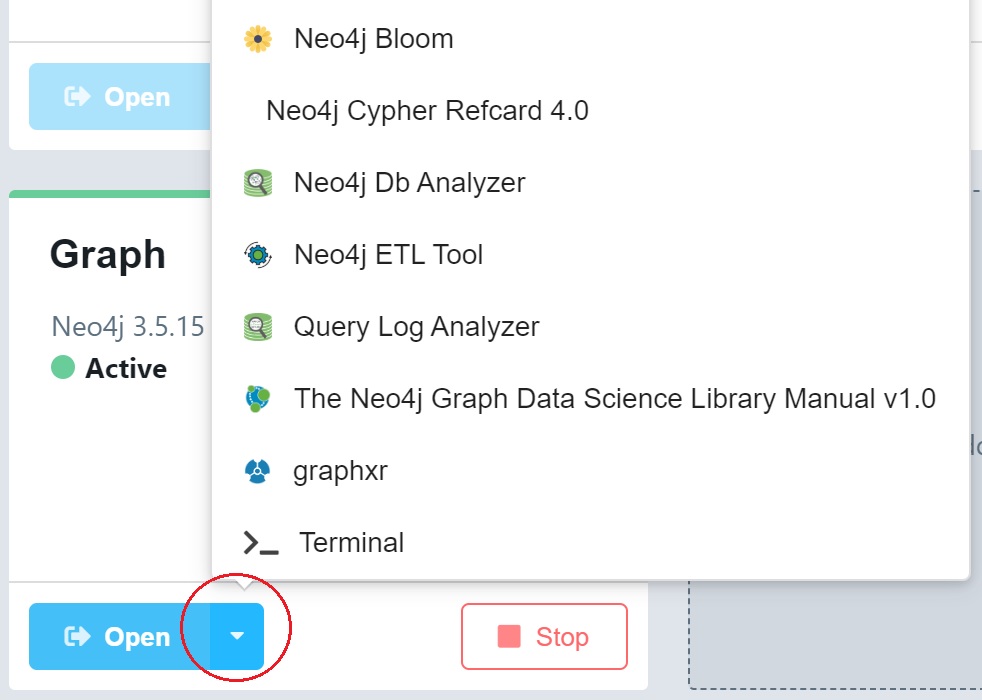
First, we need to open the application from Neo4j Desktop. Navigate to the Neo4j Desktop project where the database you wish to explore is located. Once the local database instance is started, you can launch Neo4j Bloom by clicking on the blue down arrow on the database instance, as illustrated in the image below.
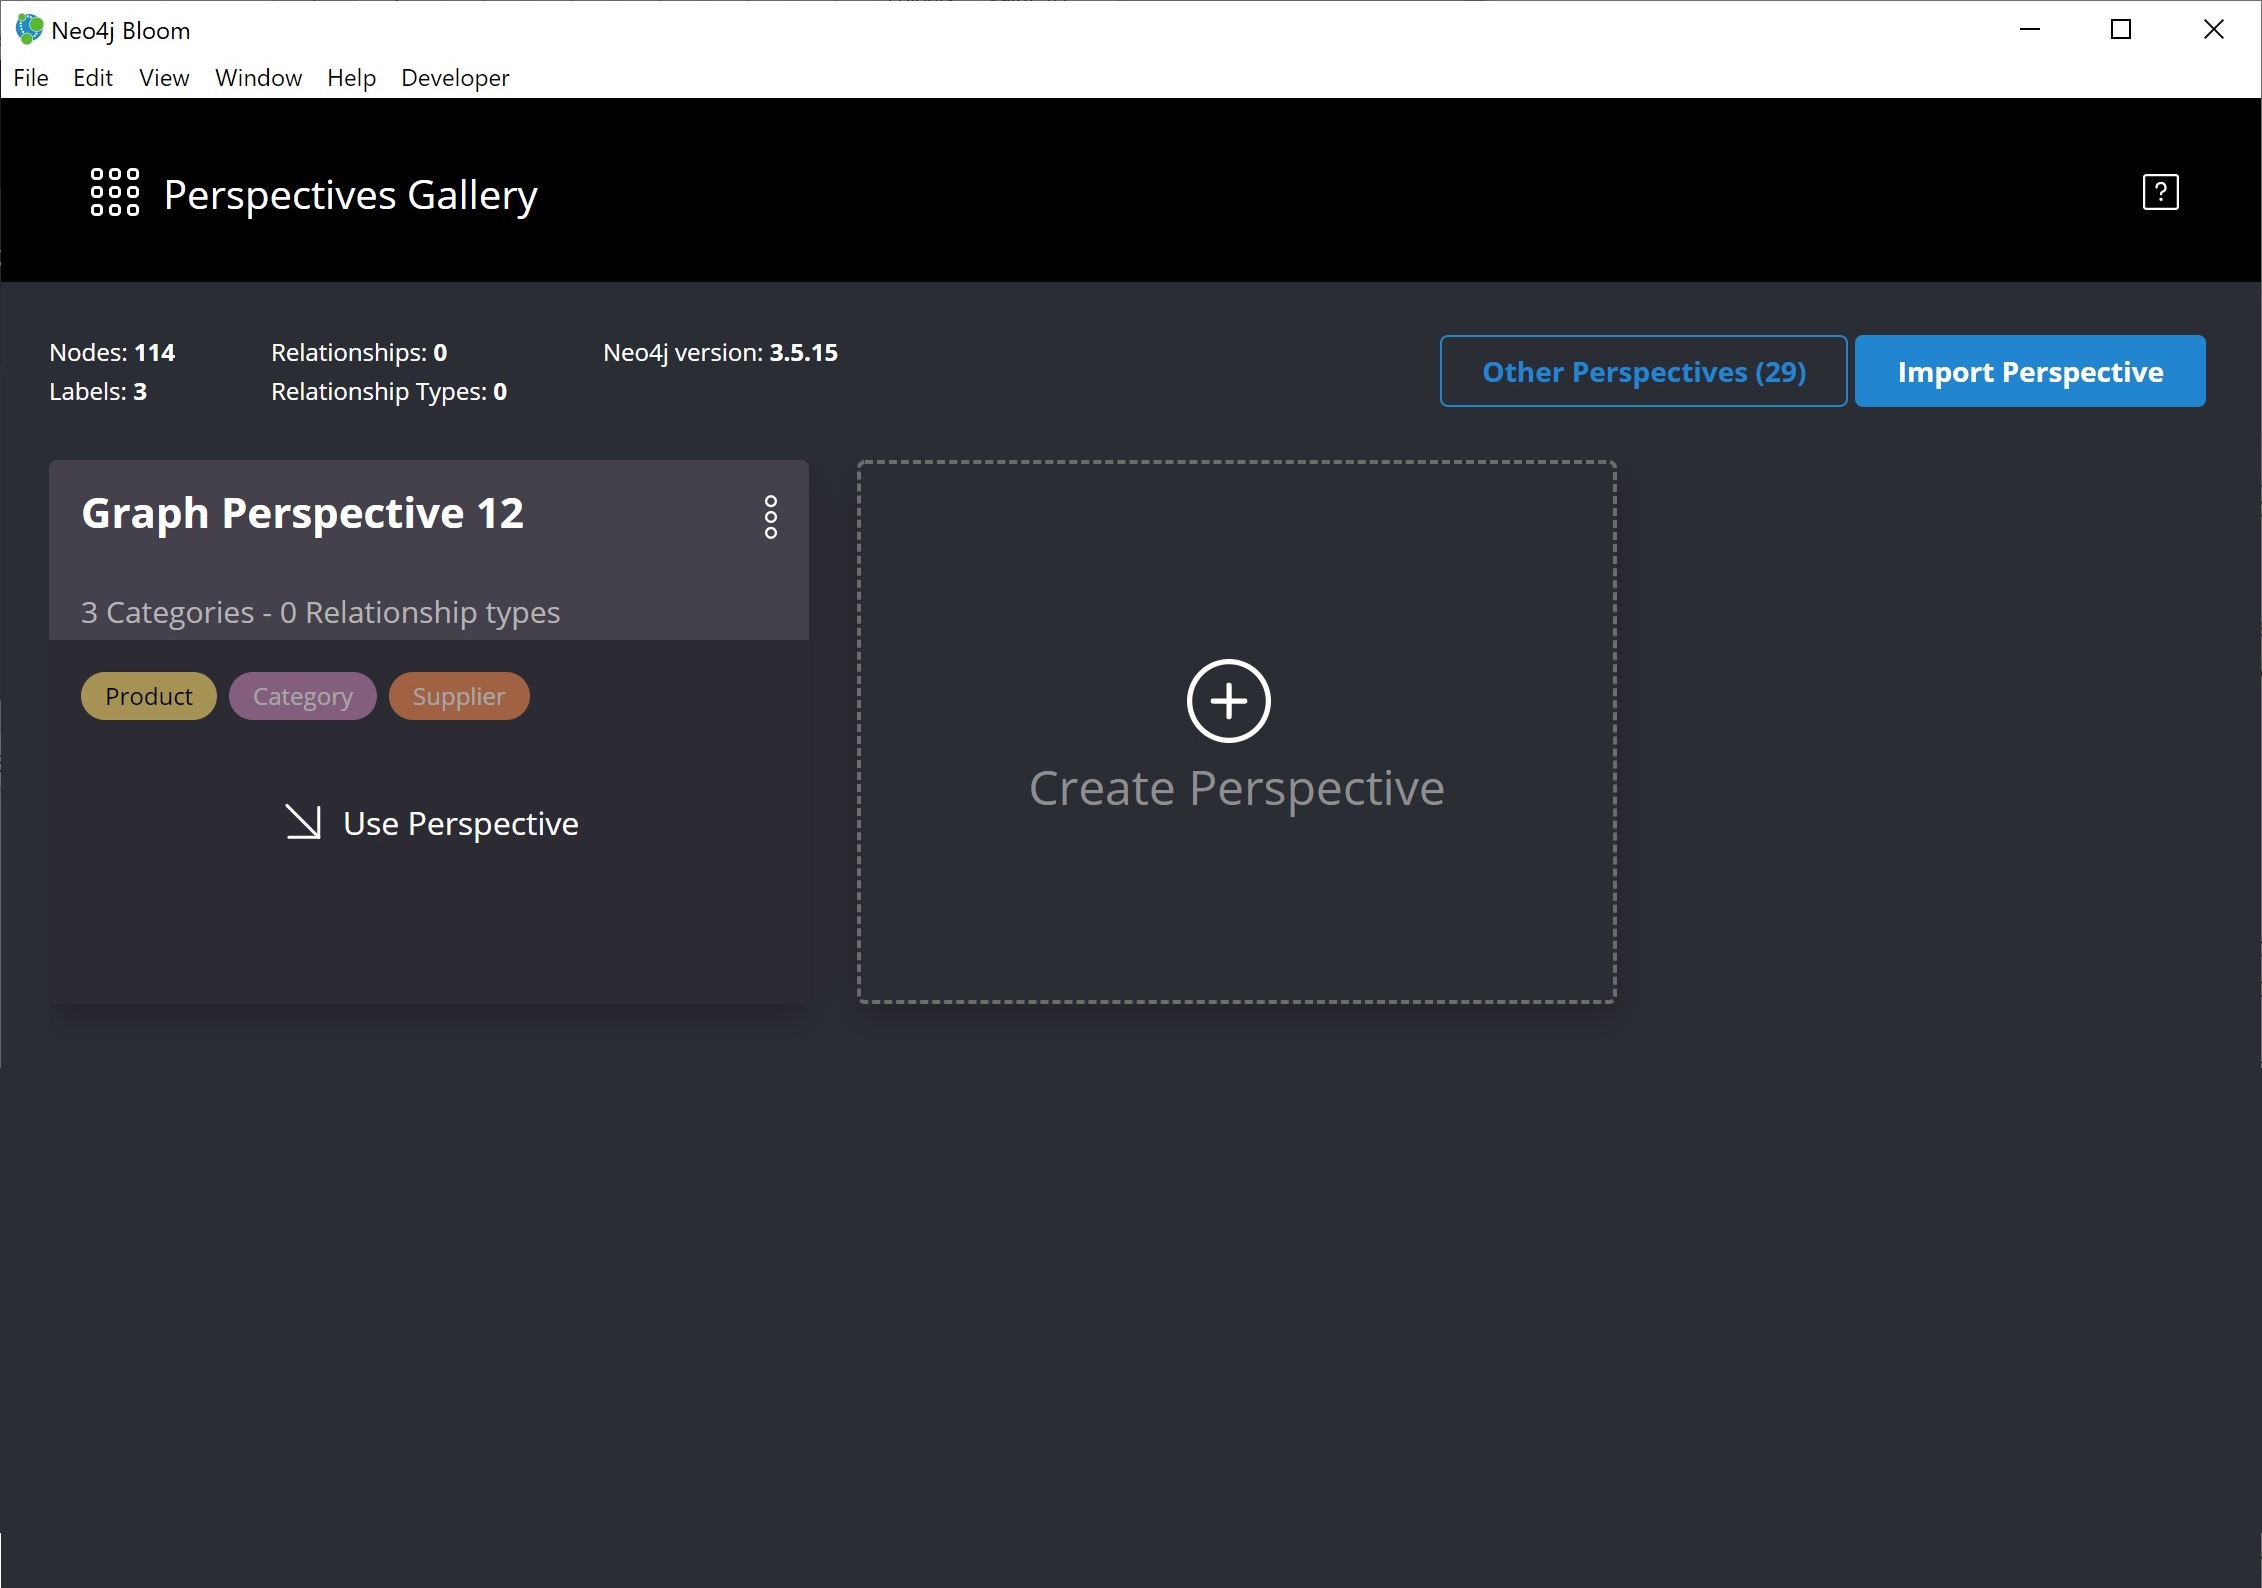
Choosing a Perspective
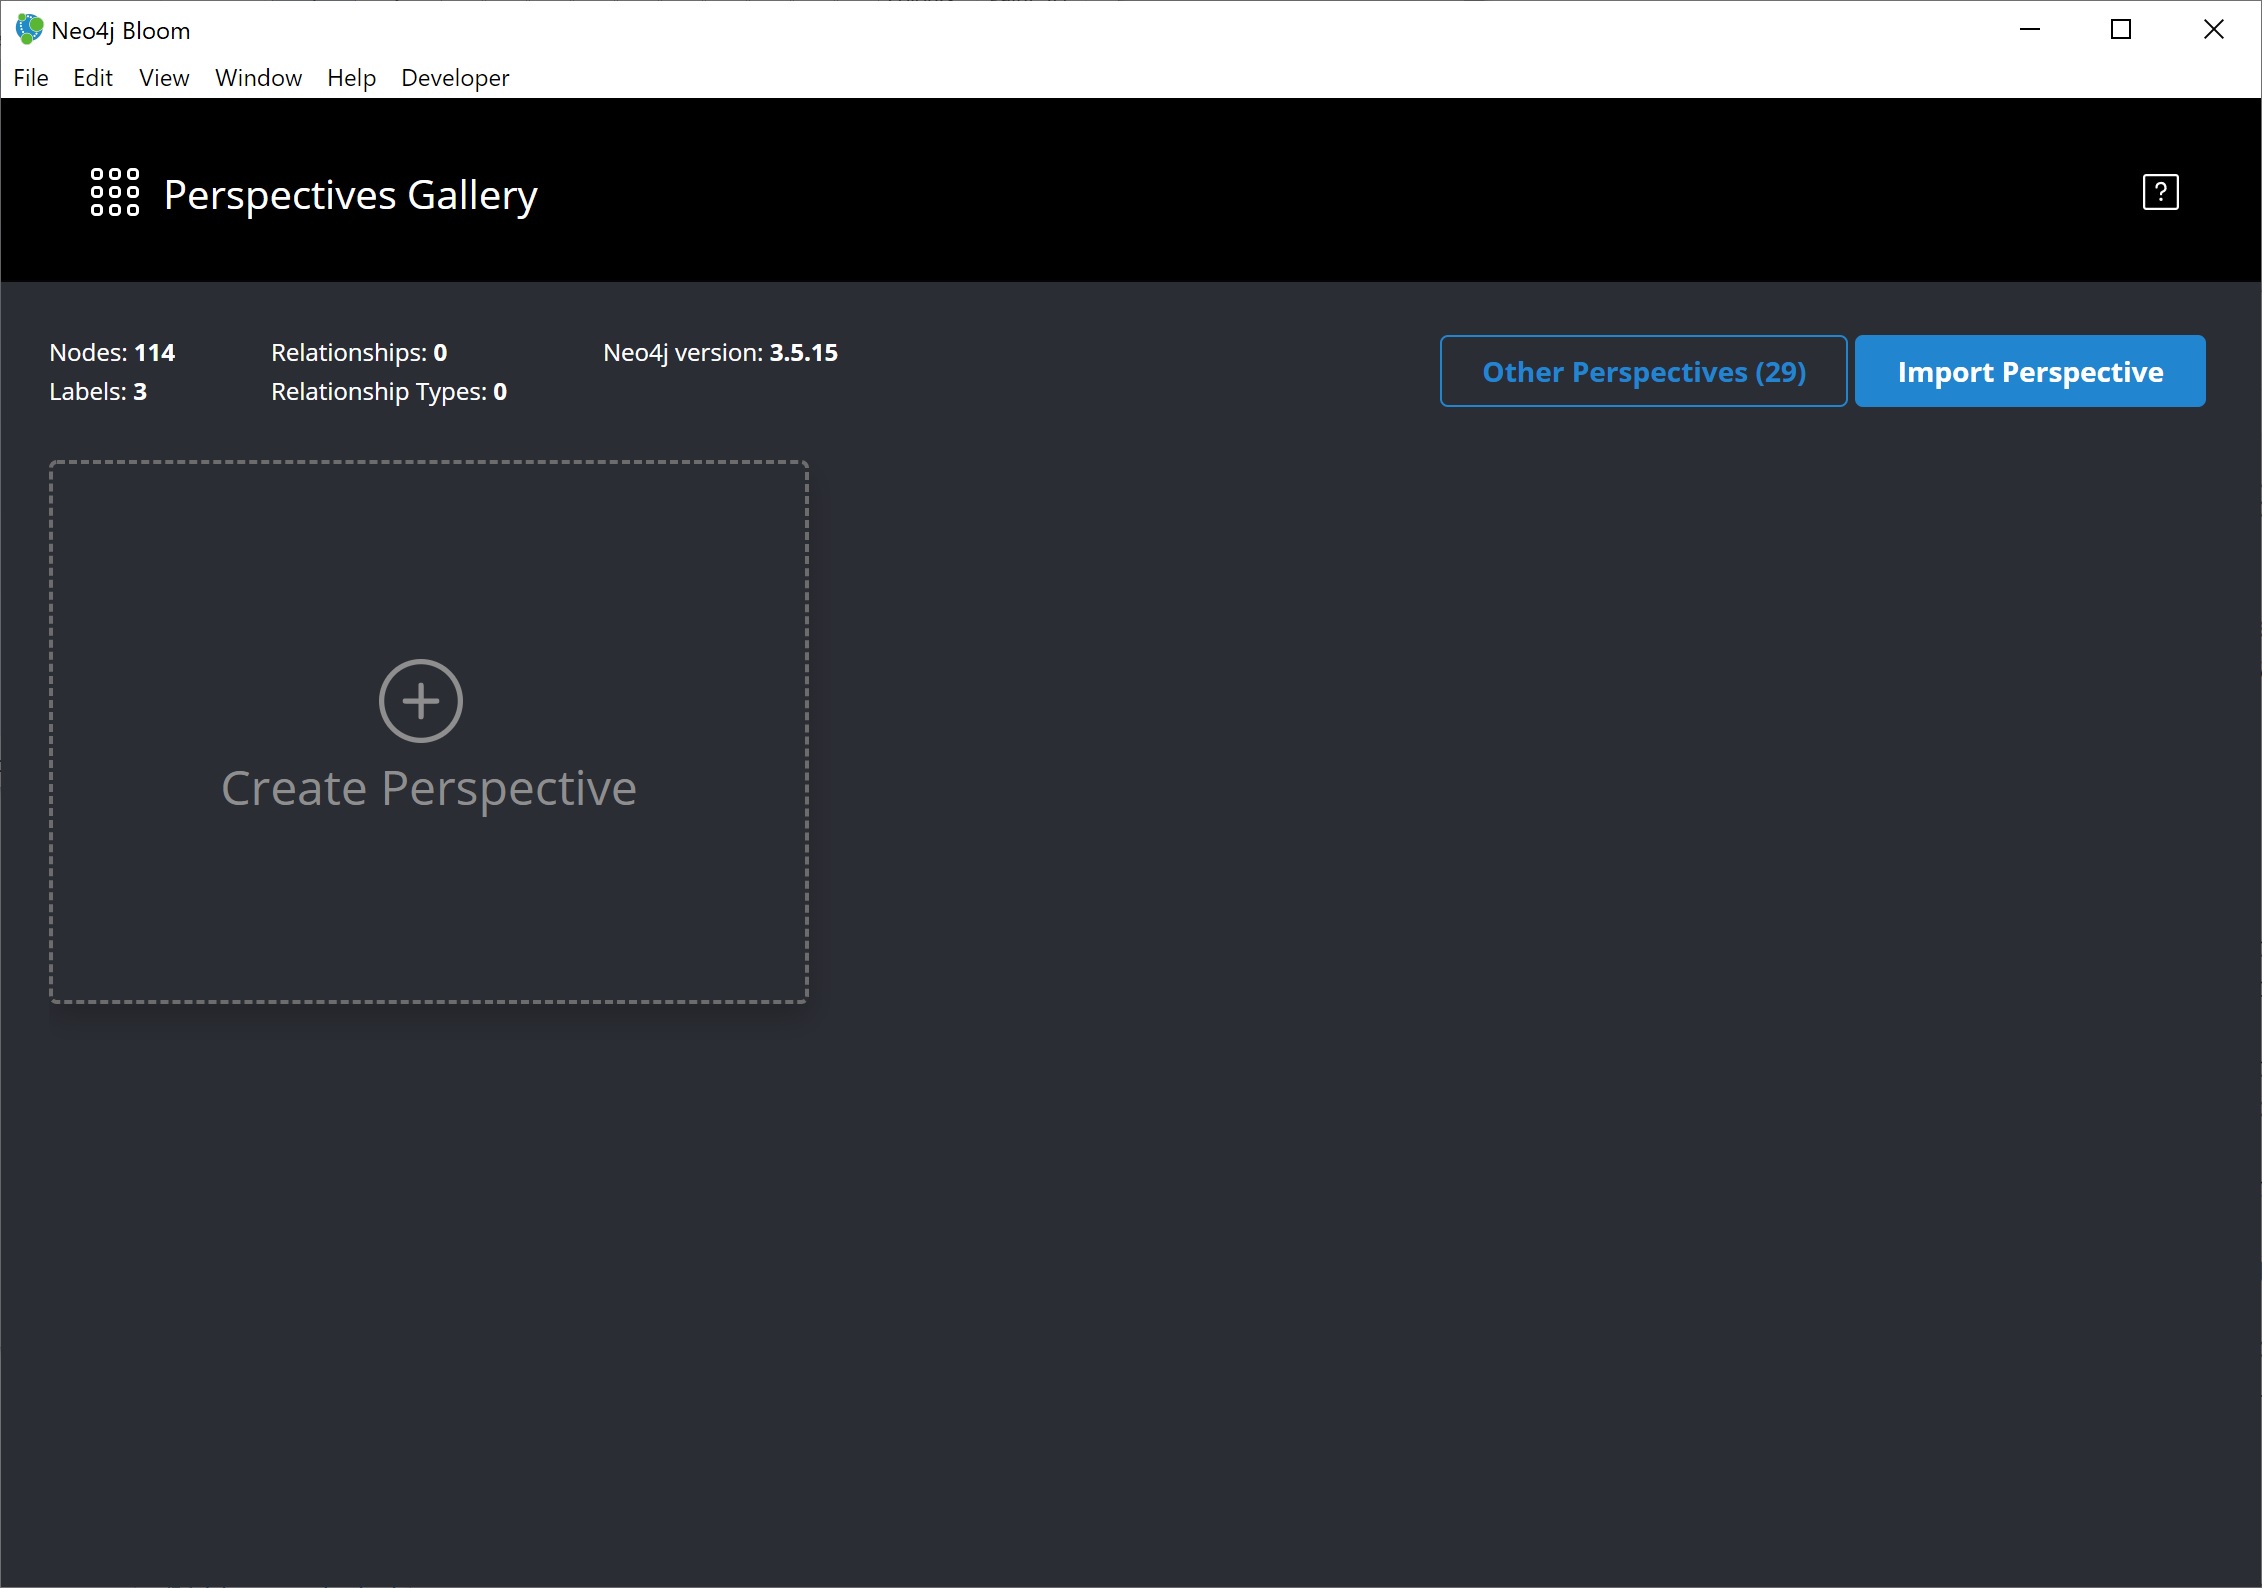
When Bloom loads, it will prompt us to choose a perspective. A perspective is a business representation of the data in the graph. Bloom can generate a default perspective based on the graph data model, or users can create different perspectives to suit their business functions or particular data needs.
The same graph can have multiple perspectives, depending on the different business views and functions. For instance, sales may view the data differently than marketing, and accounting will have more access to sensitive data than other functions of the business. All of these different functions can categorize and show/hide pieces of the graph to fit the needs of those using the data. More information on perspectives and customizing is in the documentation.
In this guide, we will choose to let Bloom generate a perspective based on the data model in our graph. It creates categories based on labels and brings over the relationships and properties found from the data.
We want to click on the button that says Generate perspective based on my data if an existing, appropriate perspective does not already exist.
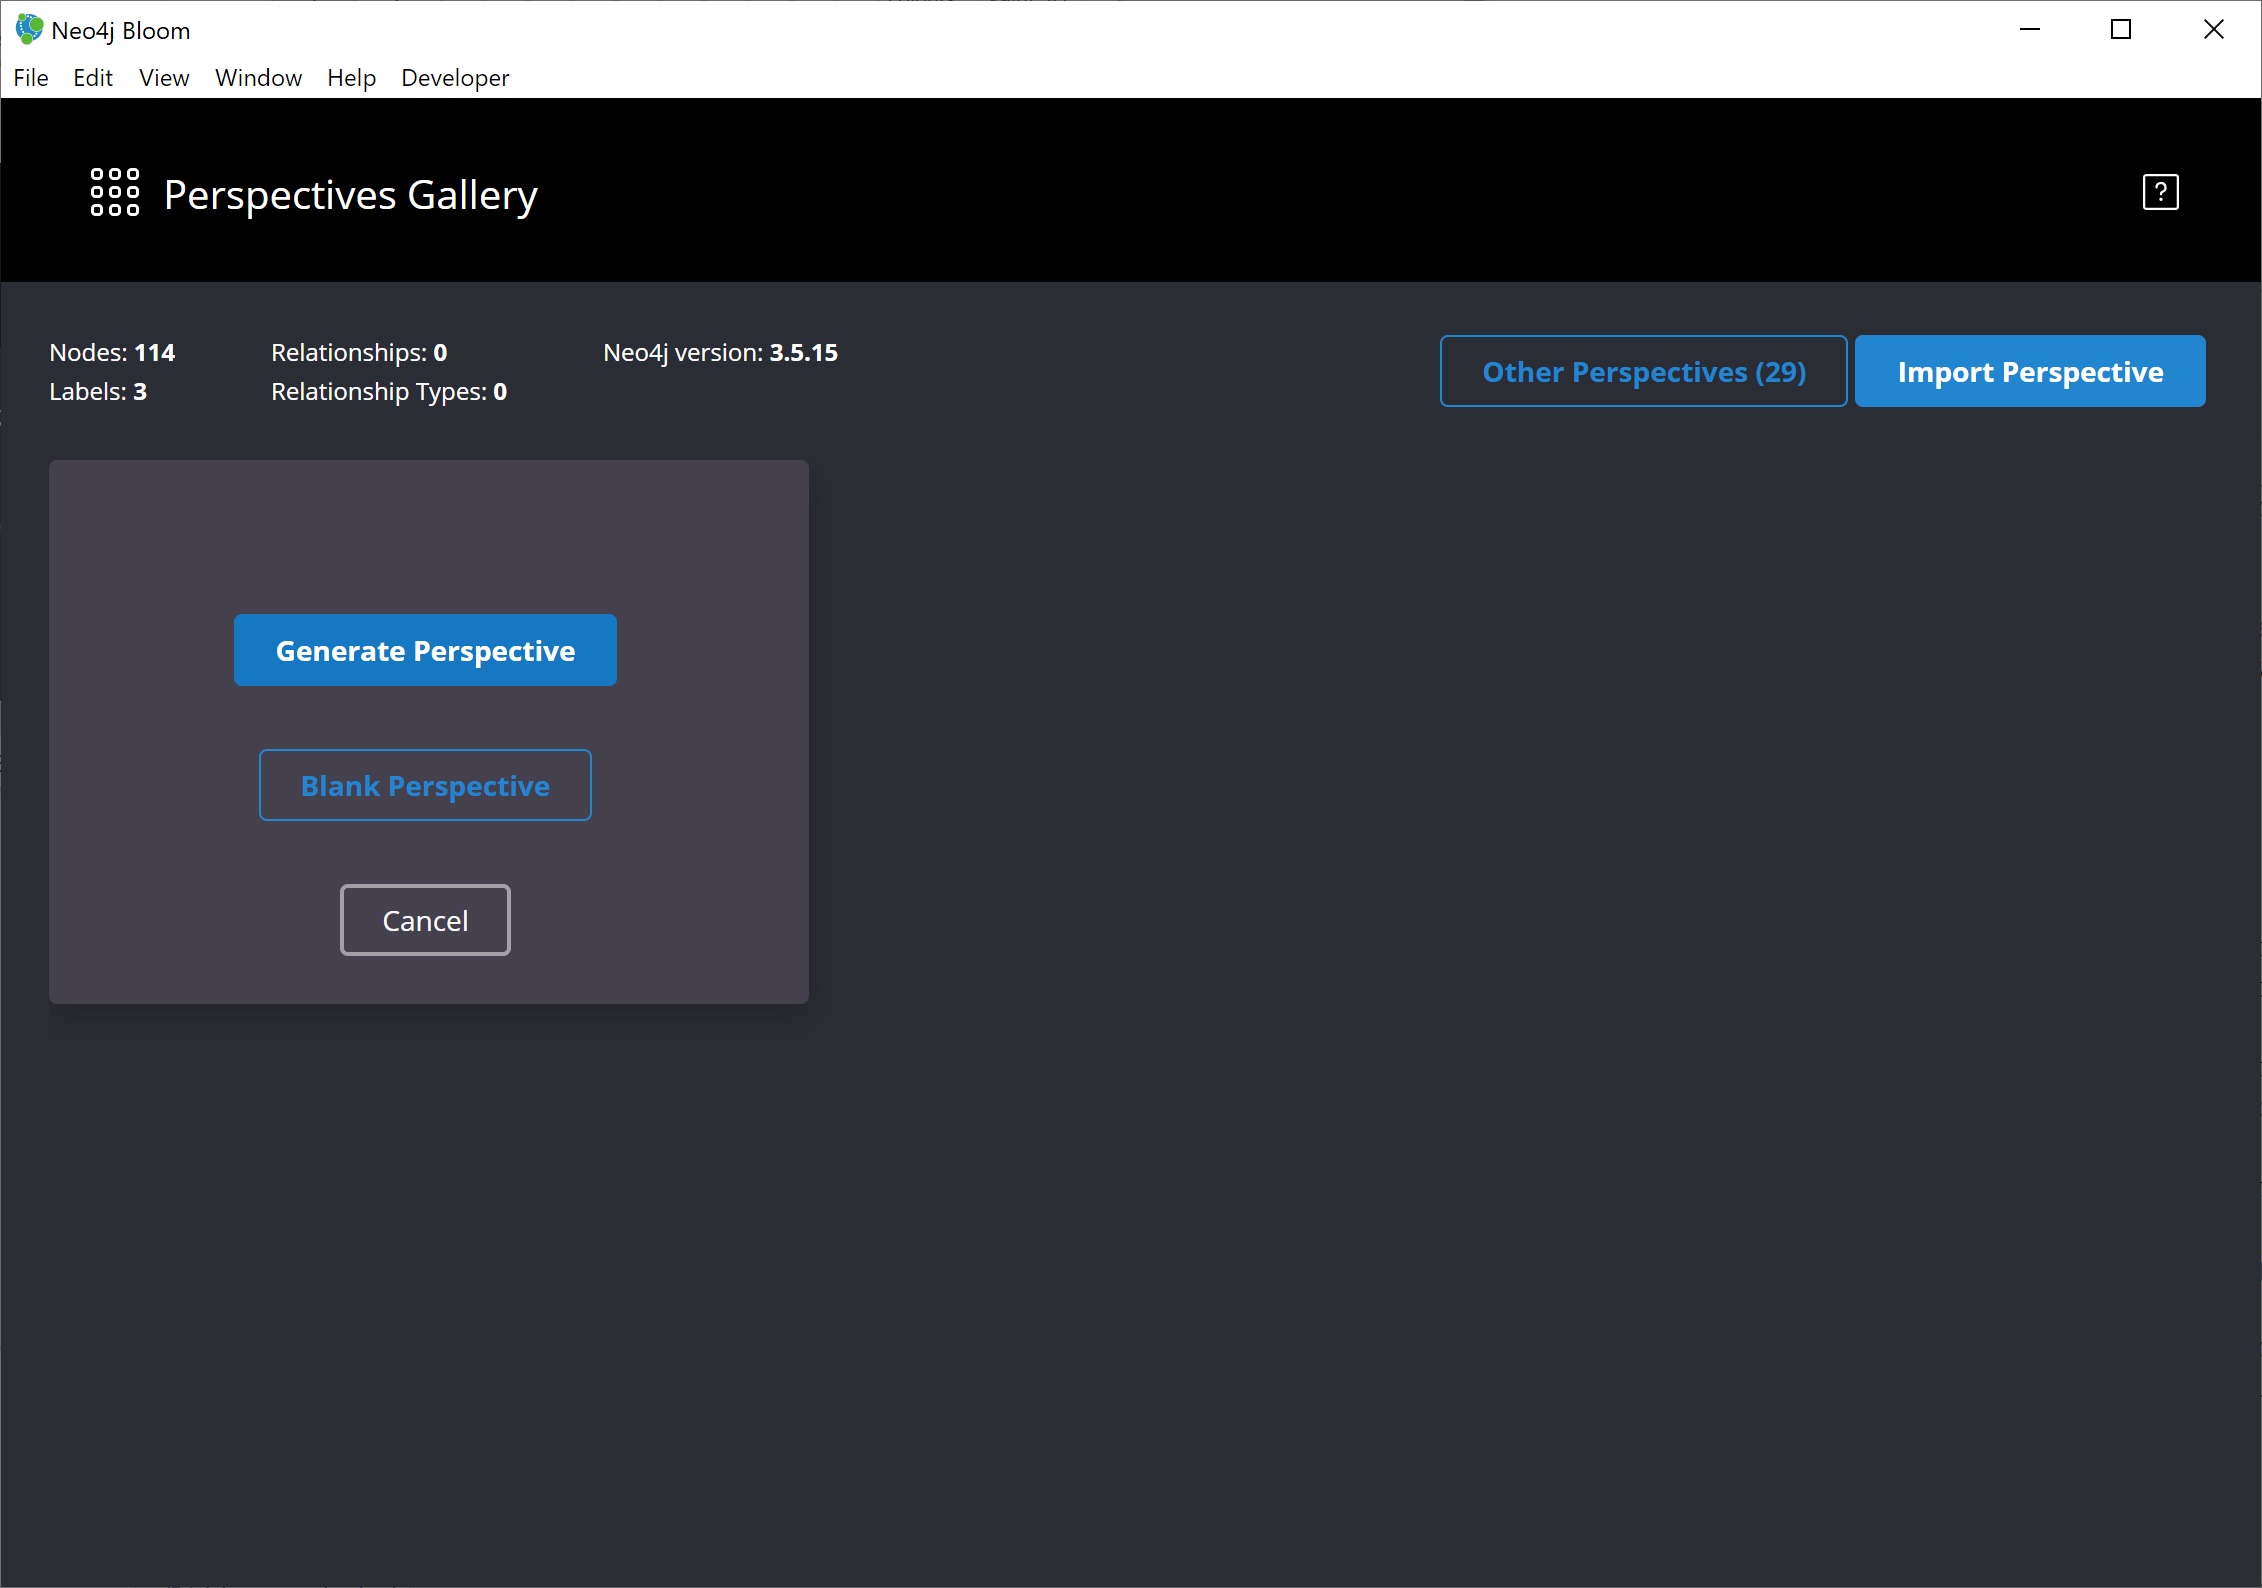
You will be given the option to either work from a blank perspective, or to generate one based on existing data. The latter option will autogenerate labels and relationships based on the data in the database.
The newly-generated perspective will then show up in the list of potential perspectives to choose from. Click Use Perspective to apply the newly-created perspective.
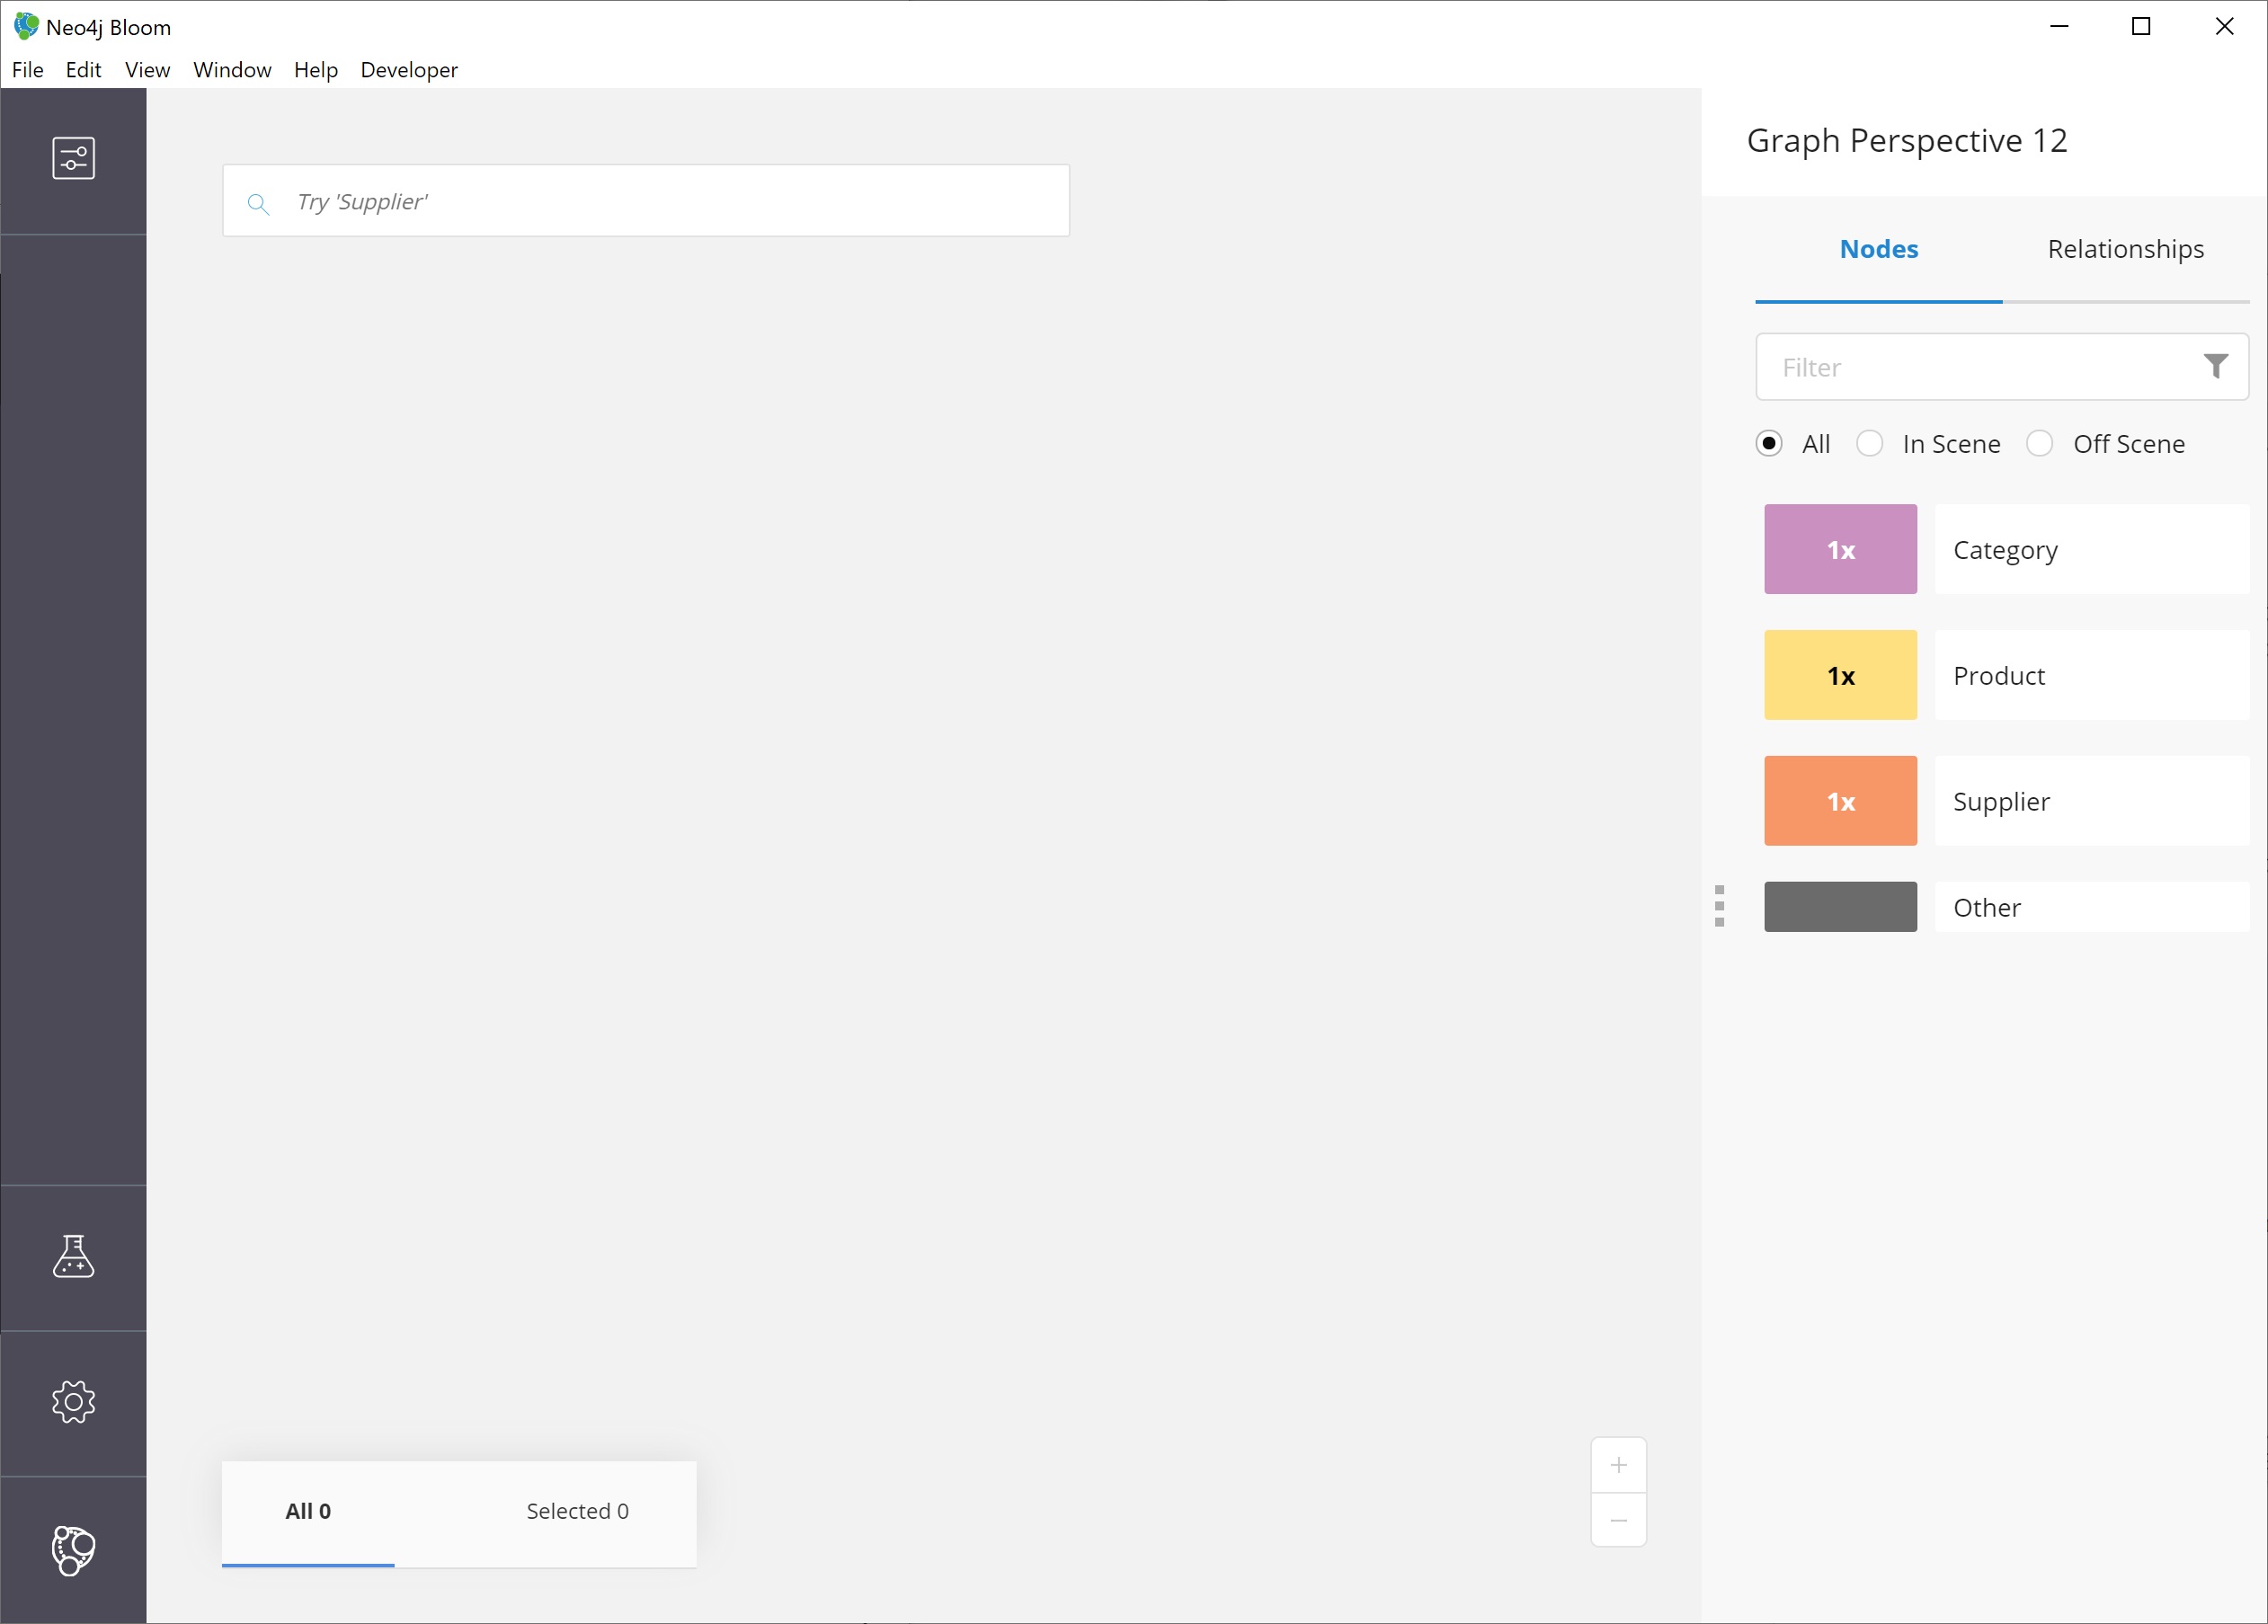
The main Bloom window now displays, with the menu tabs along the left and the main navigation and exploration pane (called the scene) covering the rest of the window. The perspective categories are listed in the upper right of the scene.
Exploring data with Bloom
Now we are ready to start exploring our data! Bloom uses query syntax that feels similar to natural language in order to express search patterns for parts of the graph users are interested in exploring.
Using the search bar
First, let us start with a small example.
We want to see the products in our retail system for the Northwind company to sell.
To do this, we can click on the search bar at the top of the scene and type in Product.
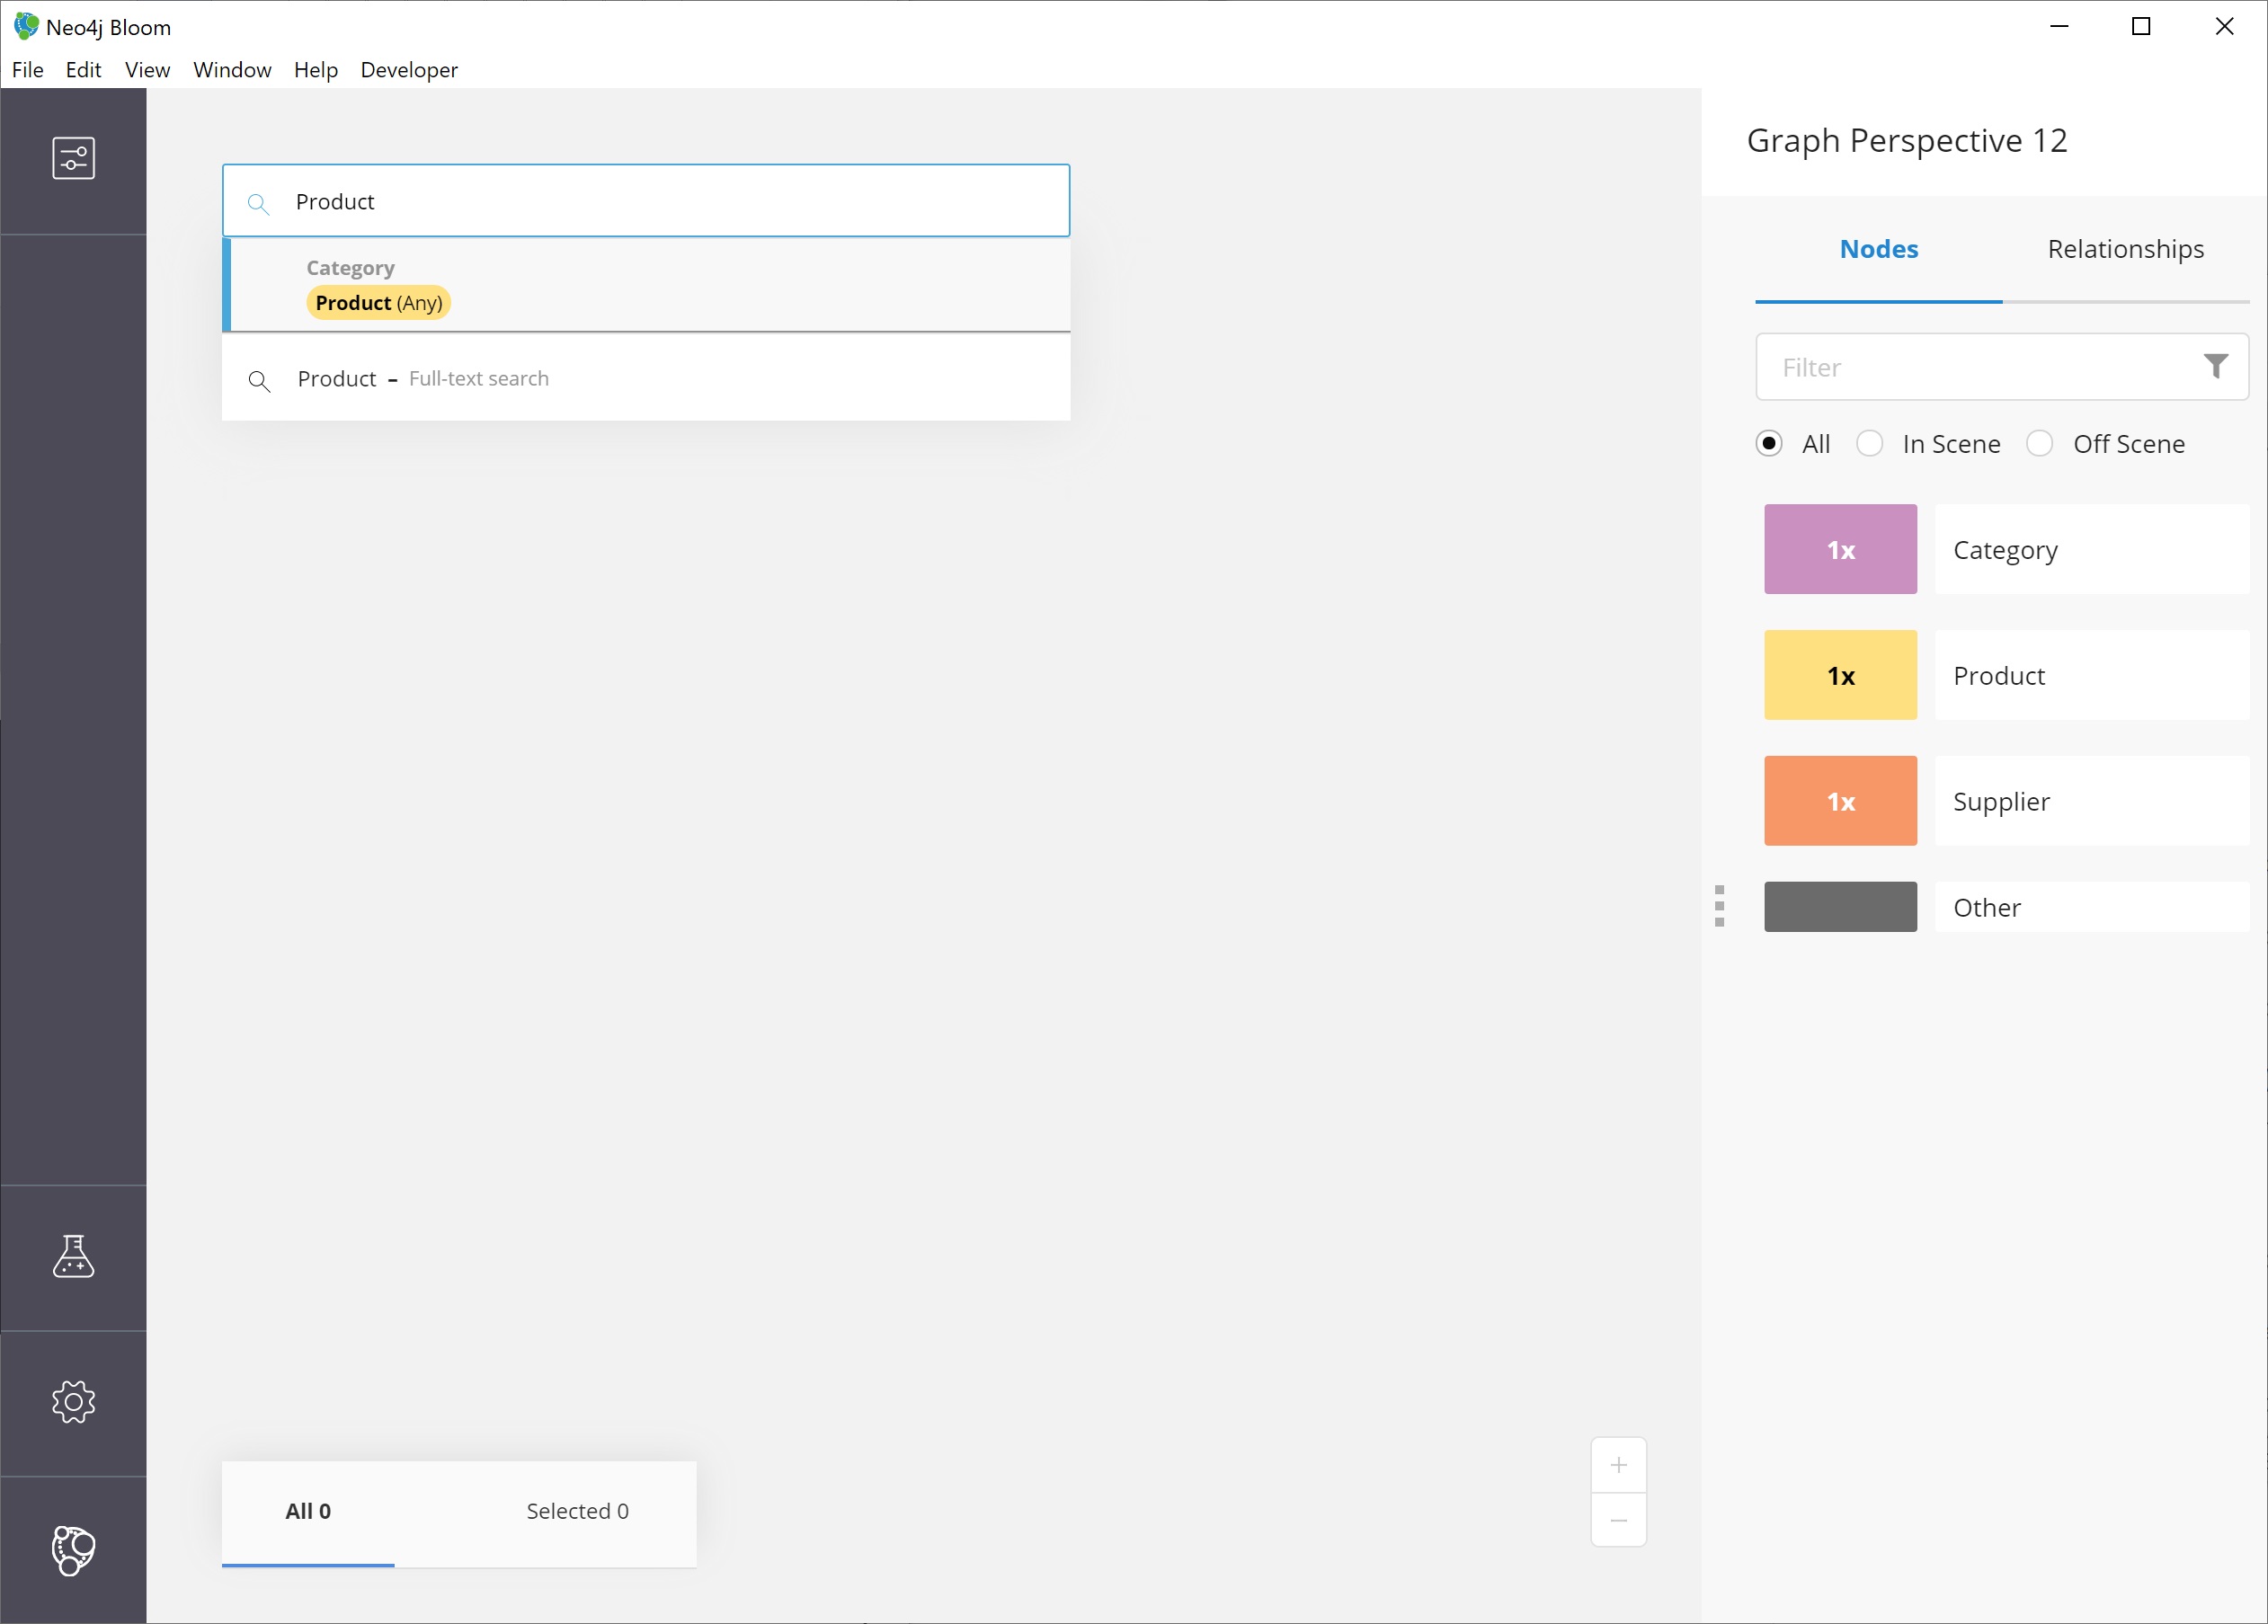
Notice that the search has prompted Bloom to offer suggestions based on what we type and includes the same category colors used in the legend on the right of the scene.
We can use the recommended suggestion for Product by ensuring it is highlighted (the top suggestion is automatically highlighted or we can use the mouse or arrow keys to highlight the option wanted), then clicking on it or pressing the Enter key.
This will bring back all the products and show them on our screen.
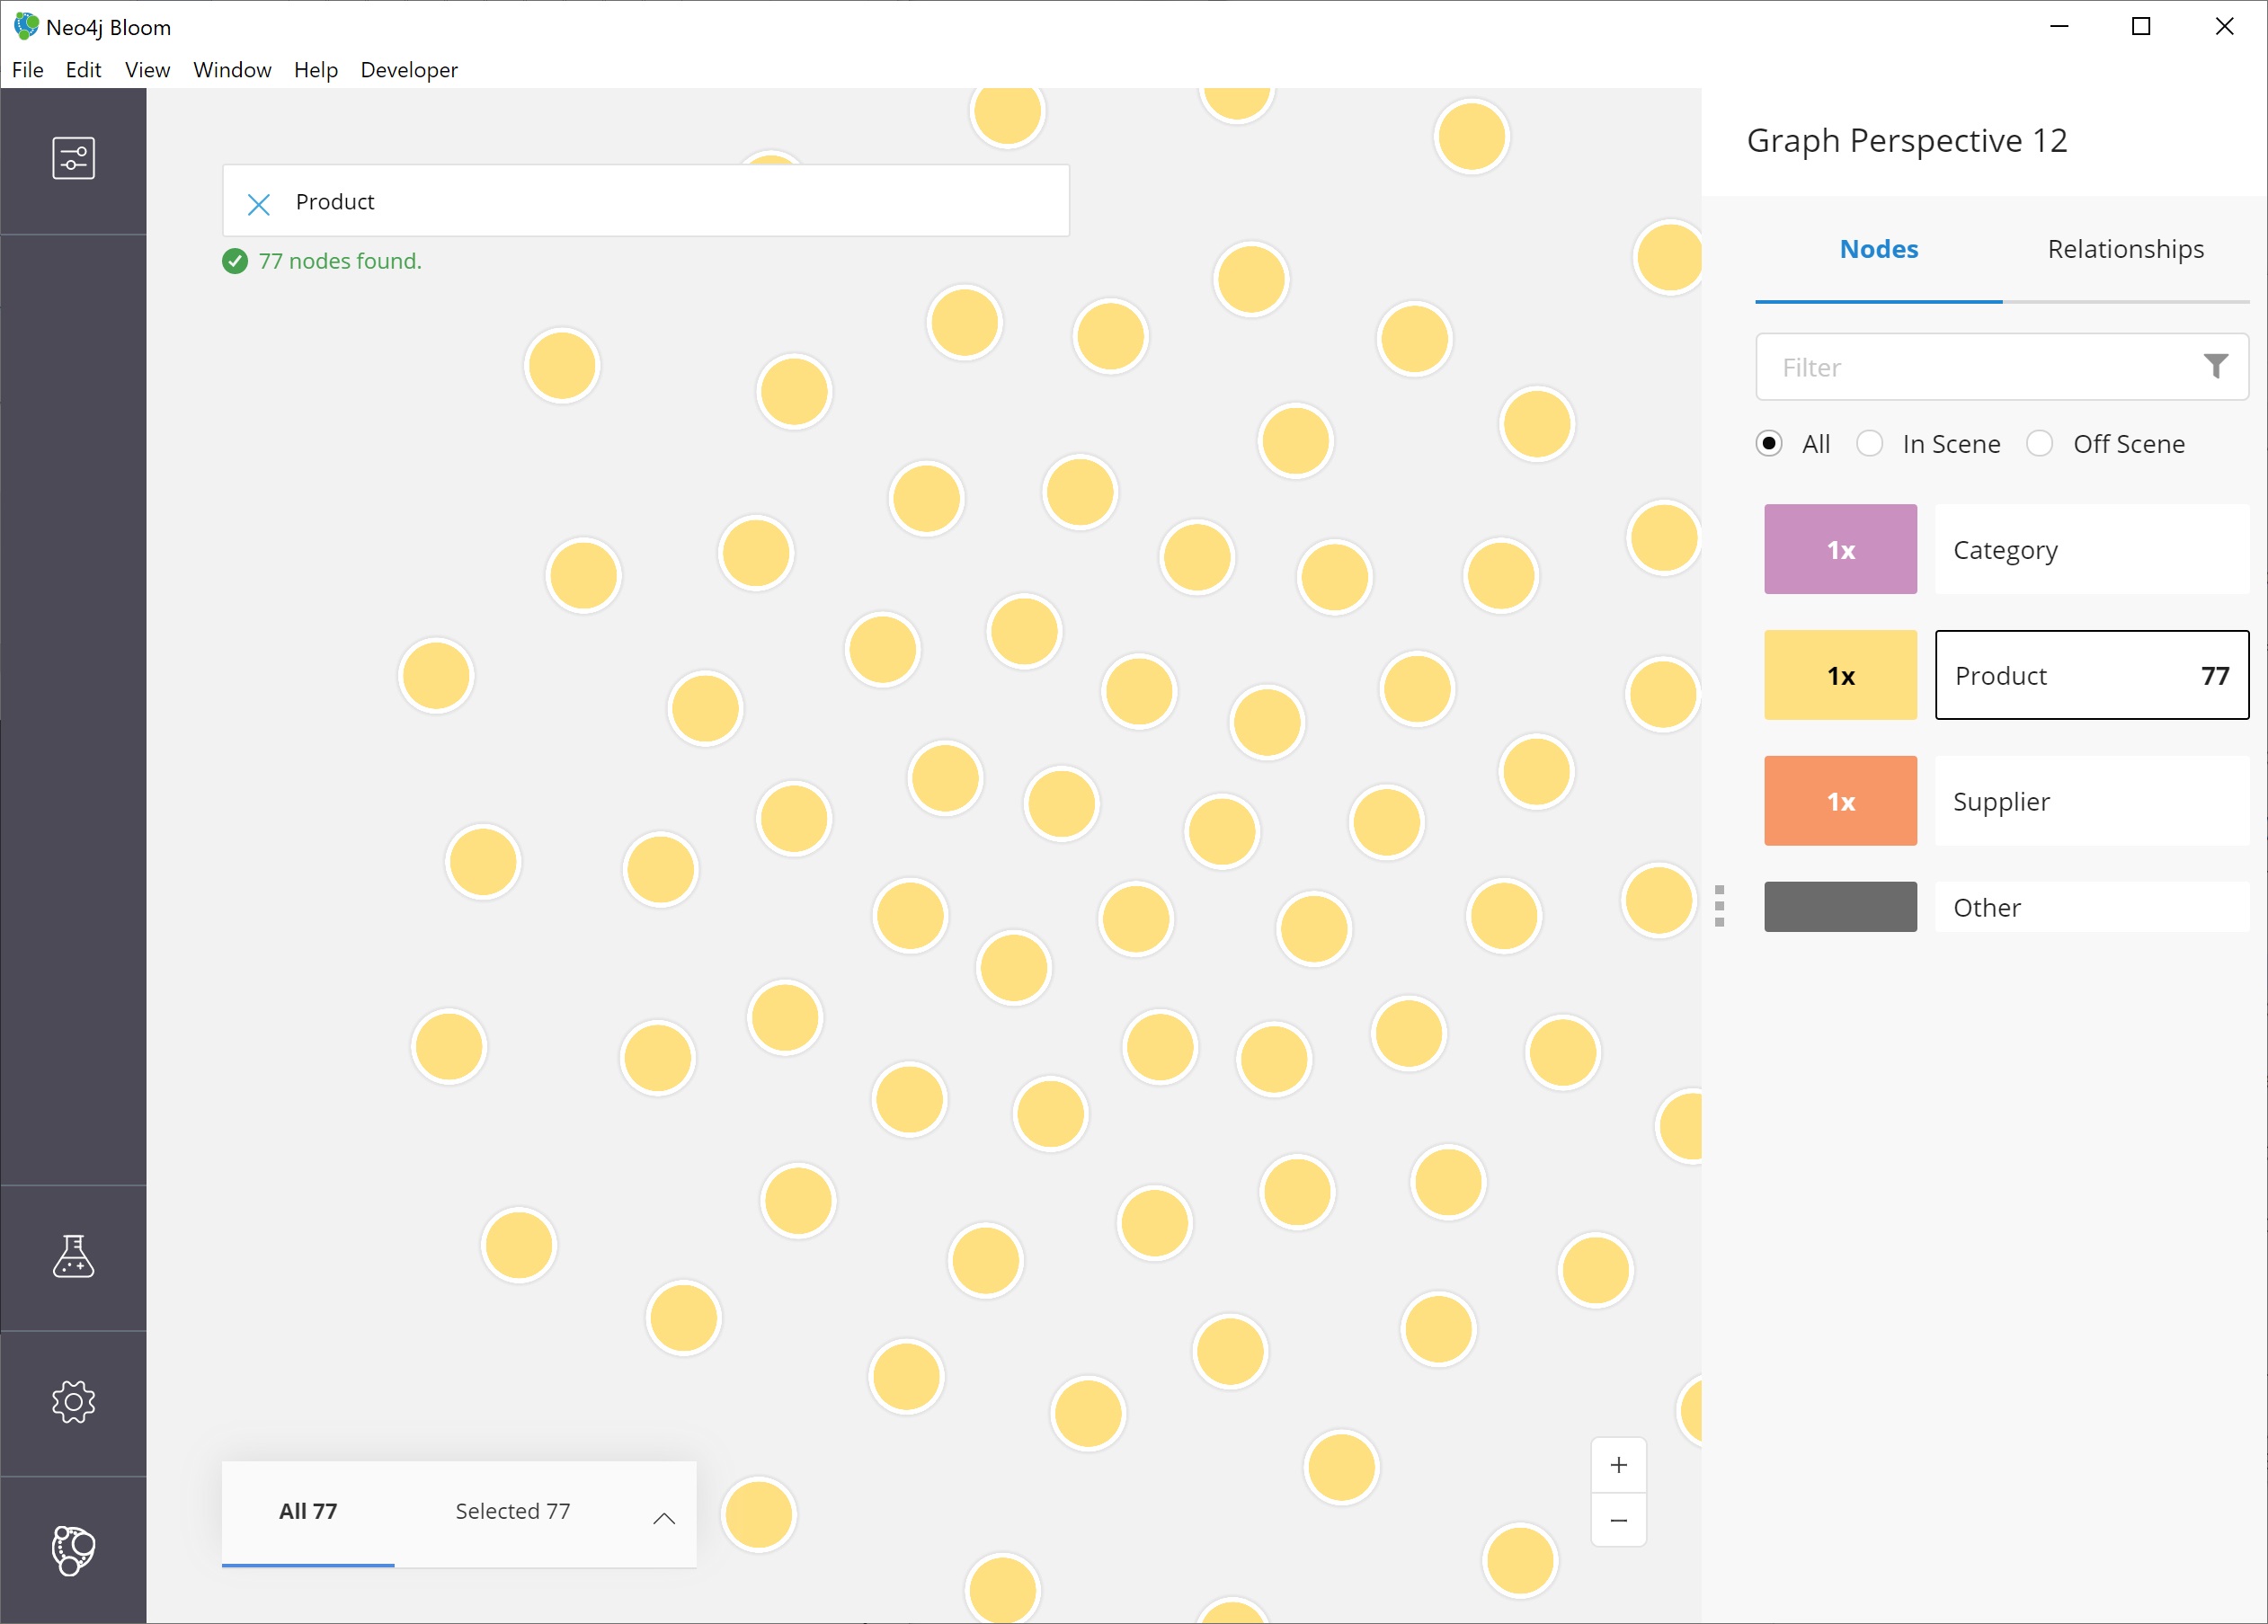
To display all of the products in the scene, Bloom has zoomed out quite a bit where we cannot see the details of each node.
We can zoom in closer to a section of the results by using the trackpad on our laptop or mouse or by using the + and - buttons in the lower right of the scene.
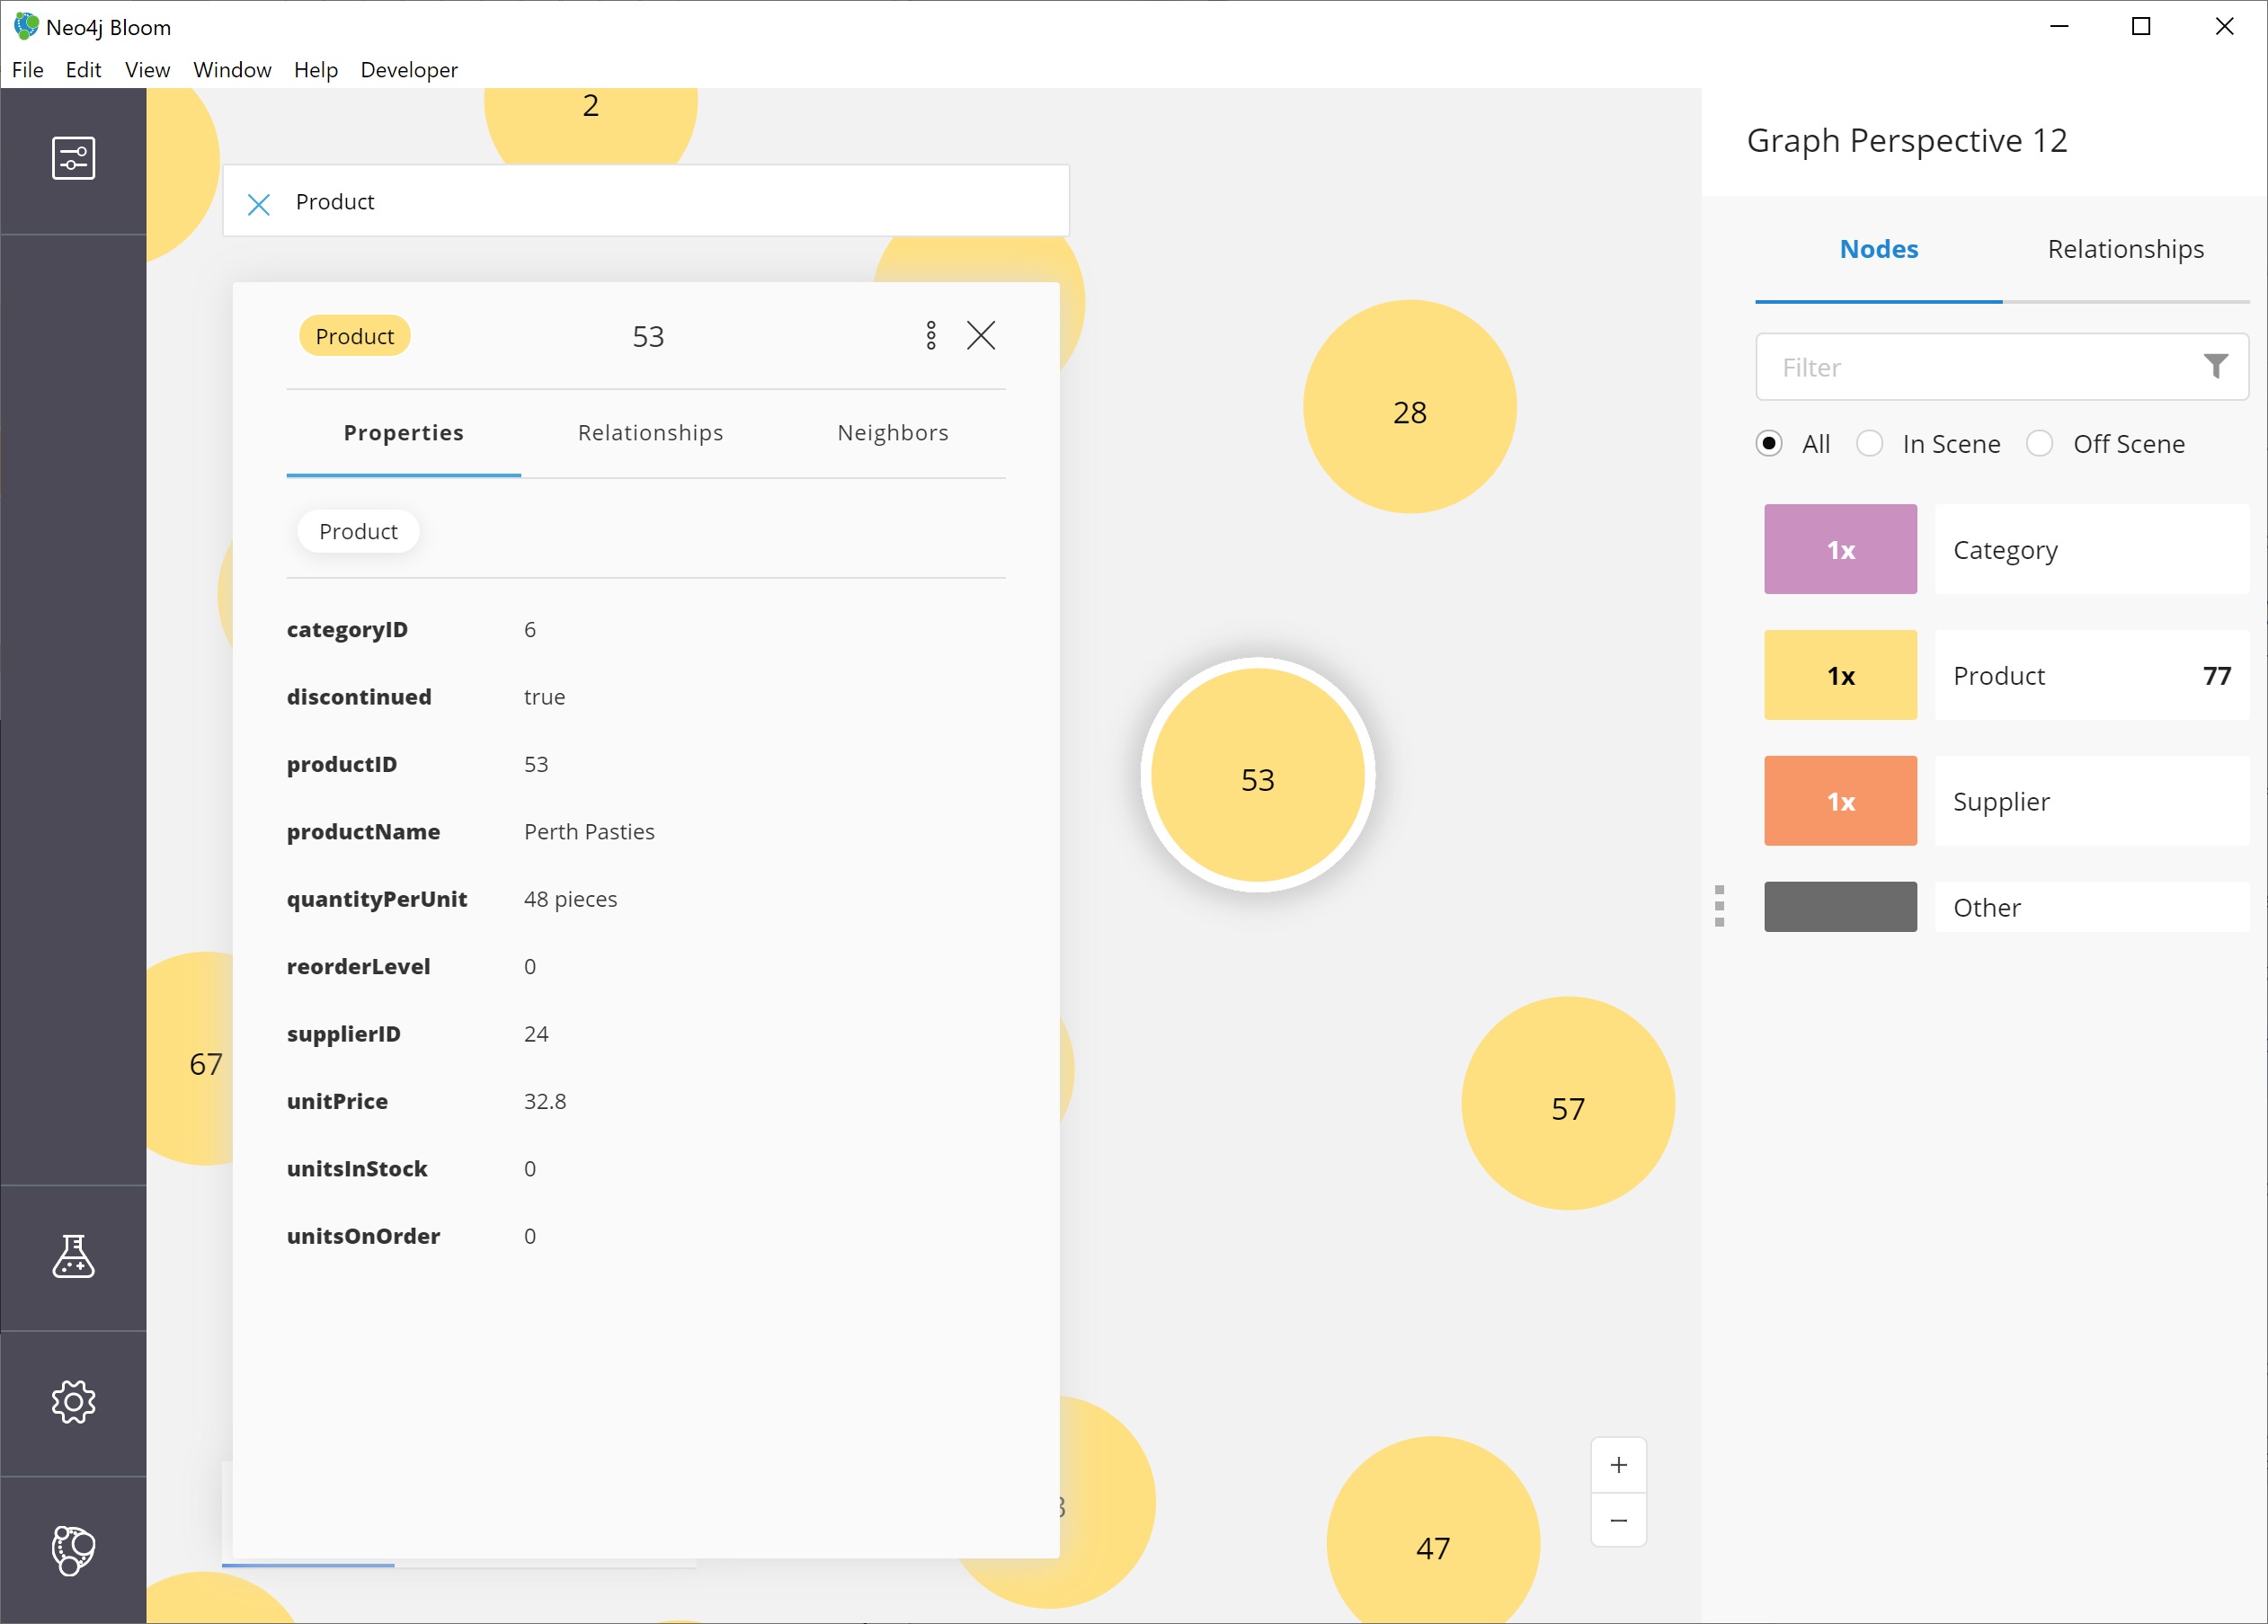
Once we zoom in a bit, we can see the property Bloom has assigned as the identifier for the node (in this case, the productID number).
We can double-click on a node to see the rest of the properties we have for it.
Altering the perspective
Now, the productID doesn’t really have as much business meaning as probably the product name, so let’s tell Bloom to show the name instead.
To do this, we open the perspective drawer in the left menu (top icon).
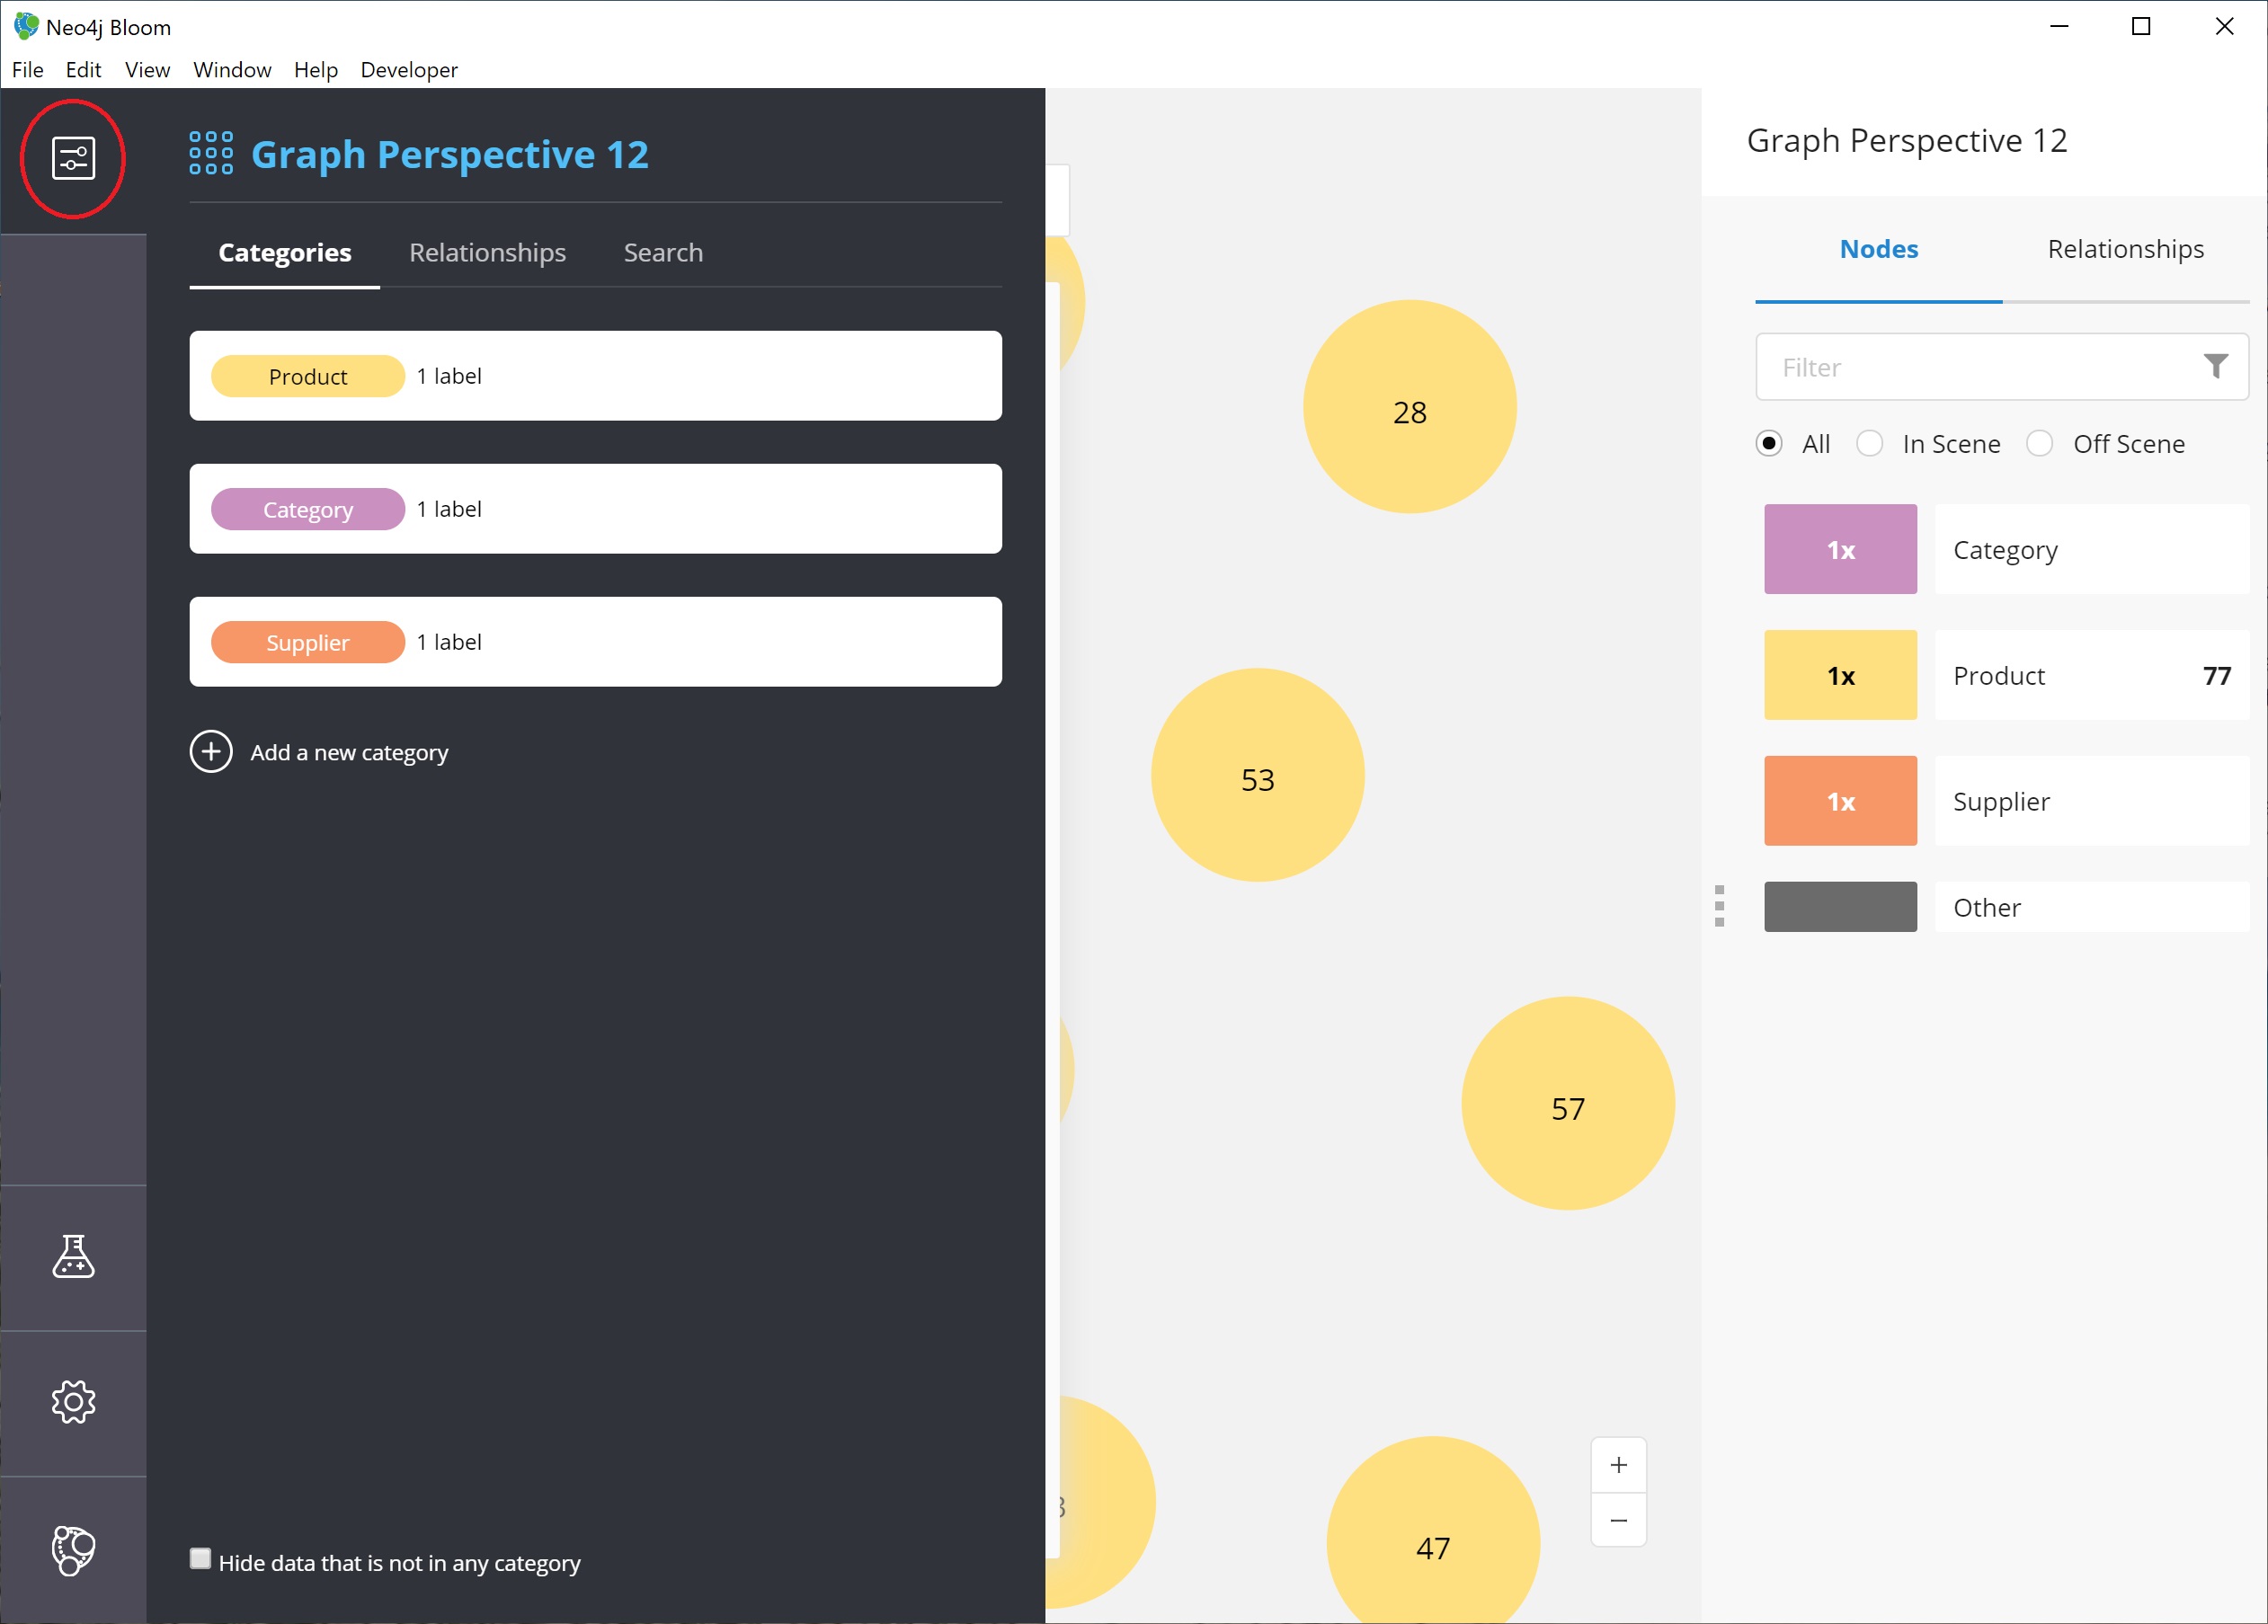
This shows us the perspective we have defined with our categories listed.
Since we want to change the property shown on the Product nodes, we can choose that category from the list.
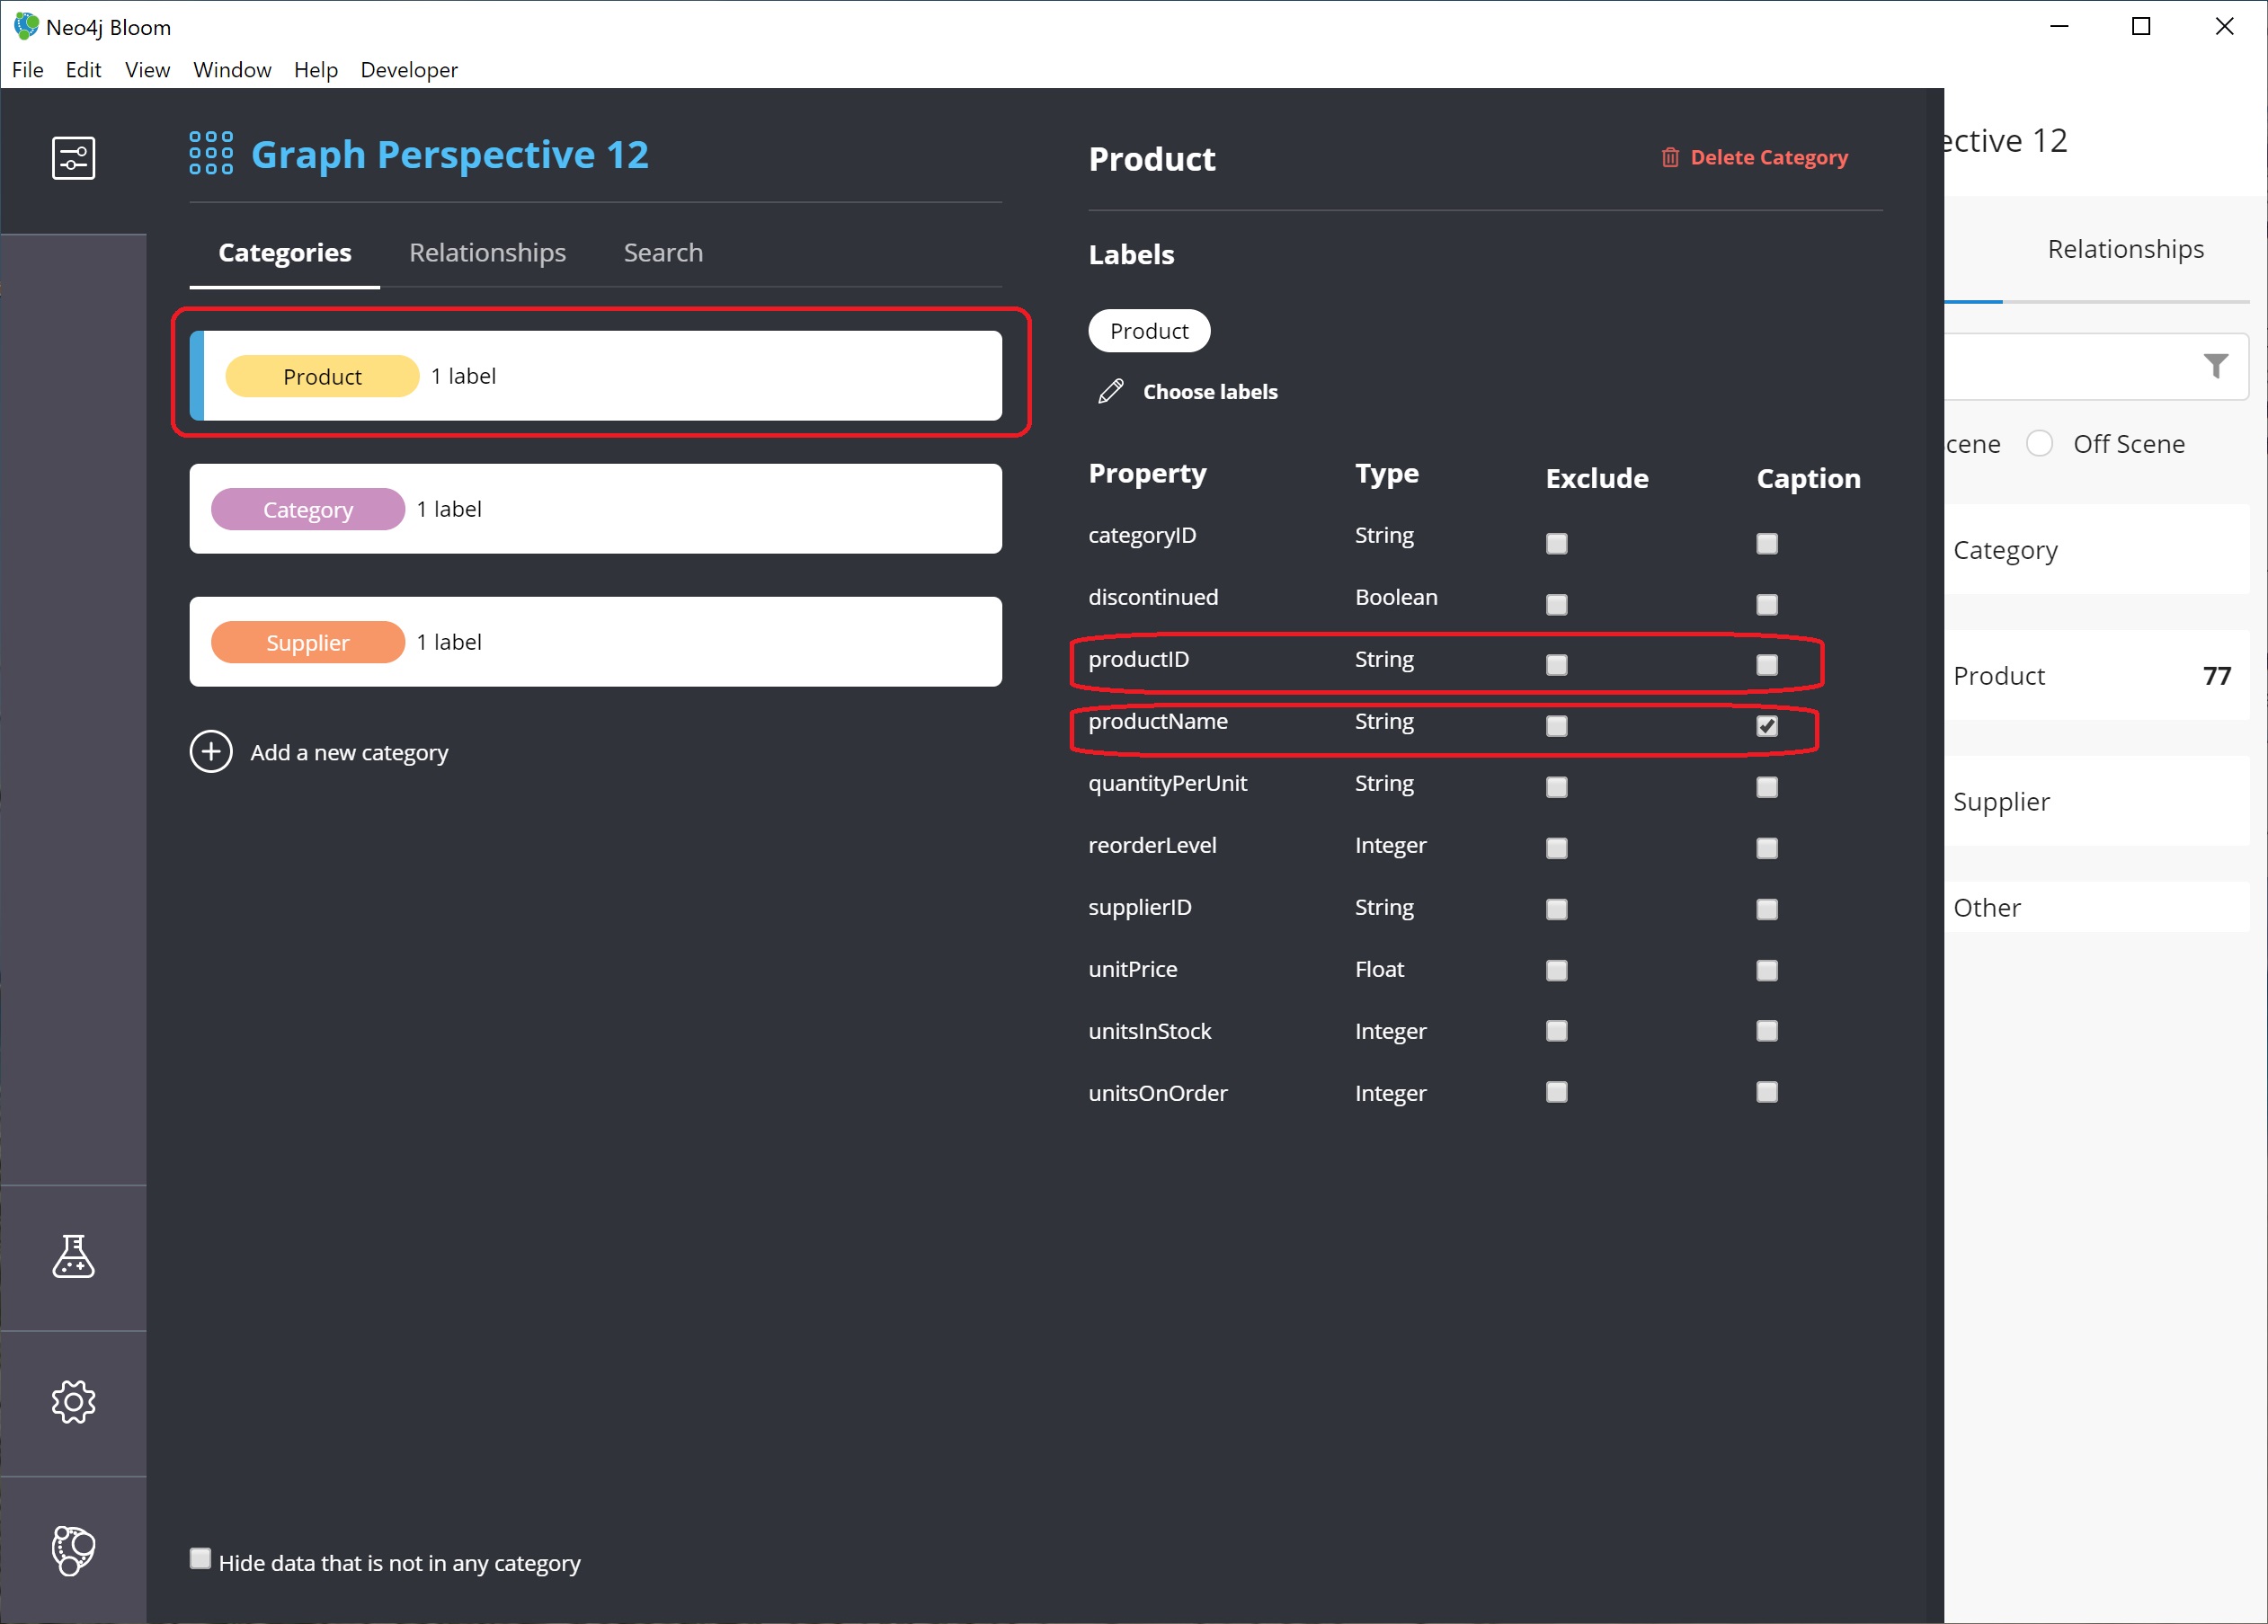
Another panel pops out to the right, and we can see all of the properties and whether to show or hide (exclude) them from the perspective.
For our example, we will choose to show the productName property, so check the box next to that property under the Caption column and uncheck the Caption checkbox for the productID property.
If we leave both properties checked as captions, then both properties will be shown on the nodes.
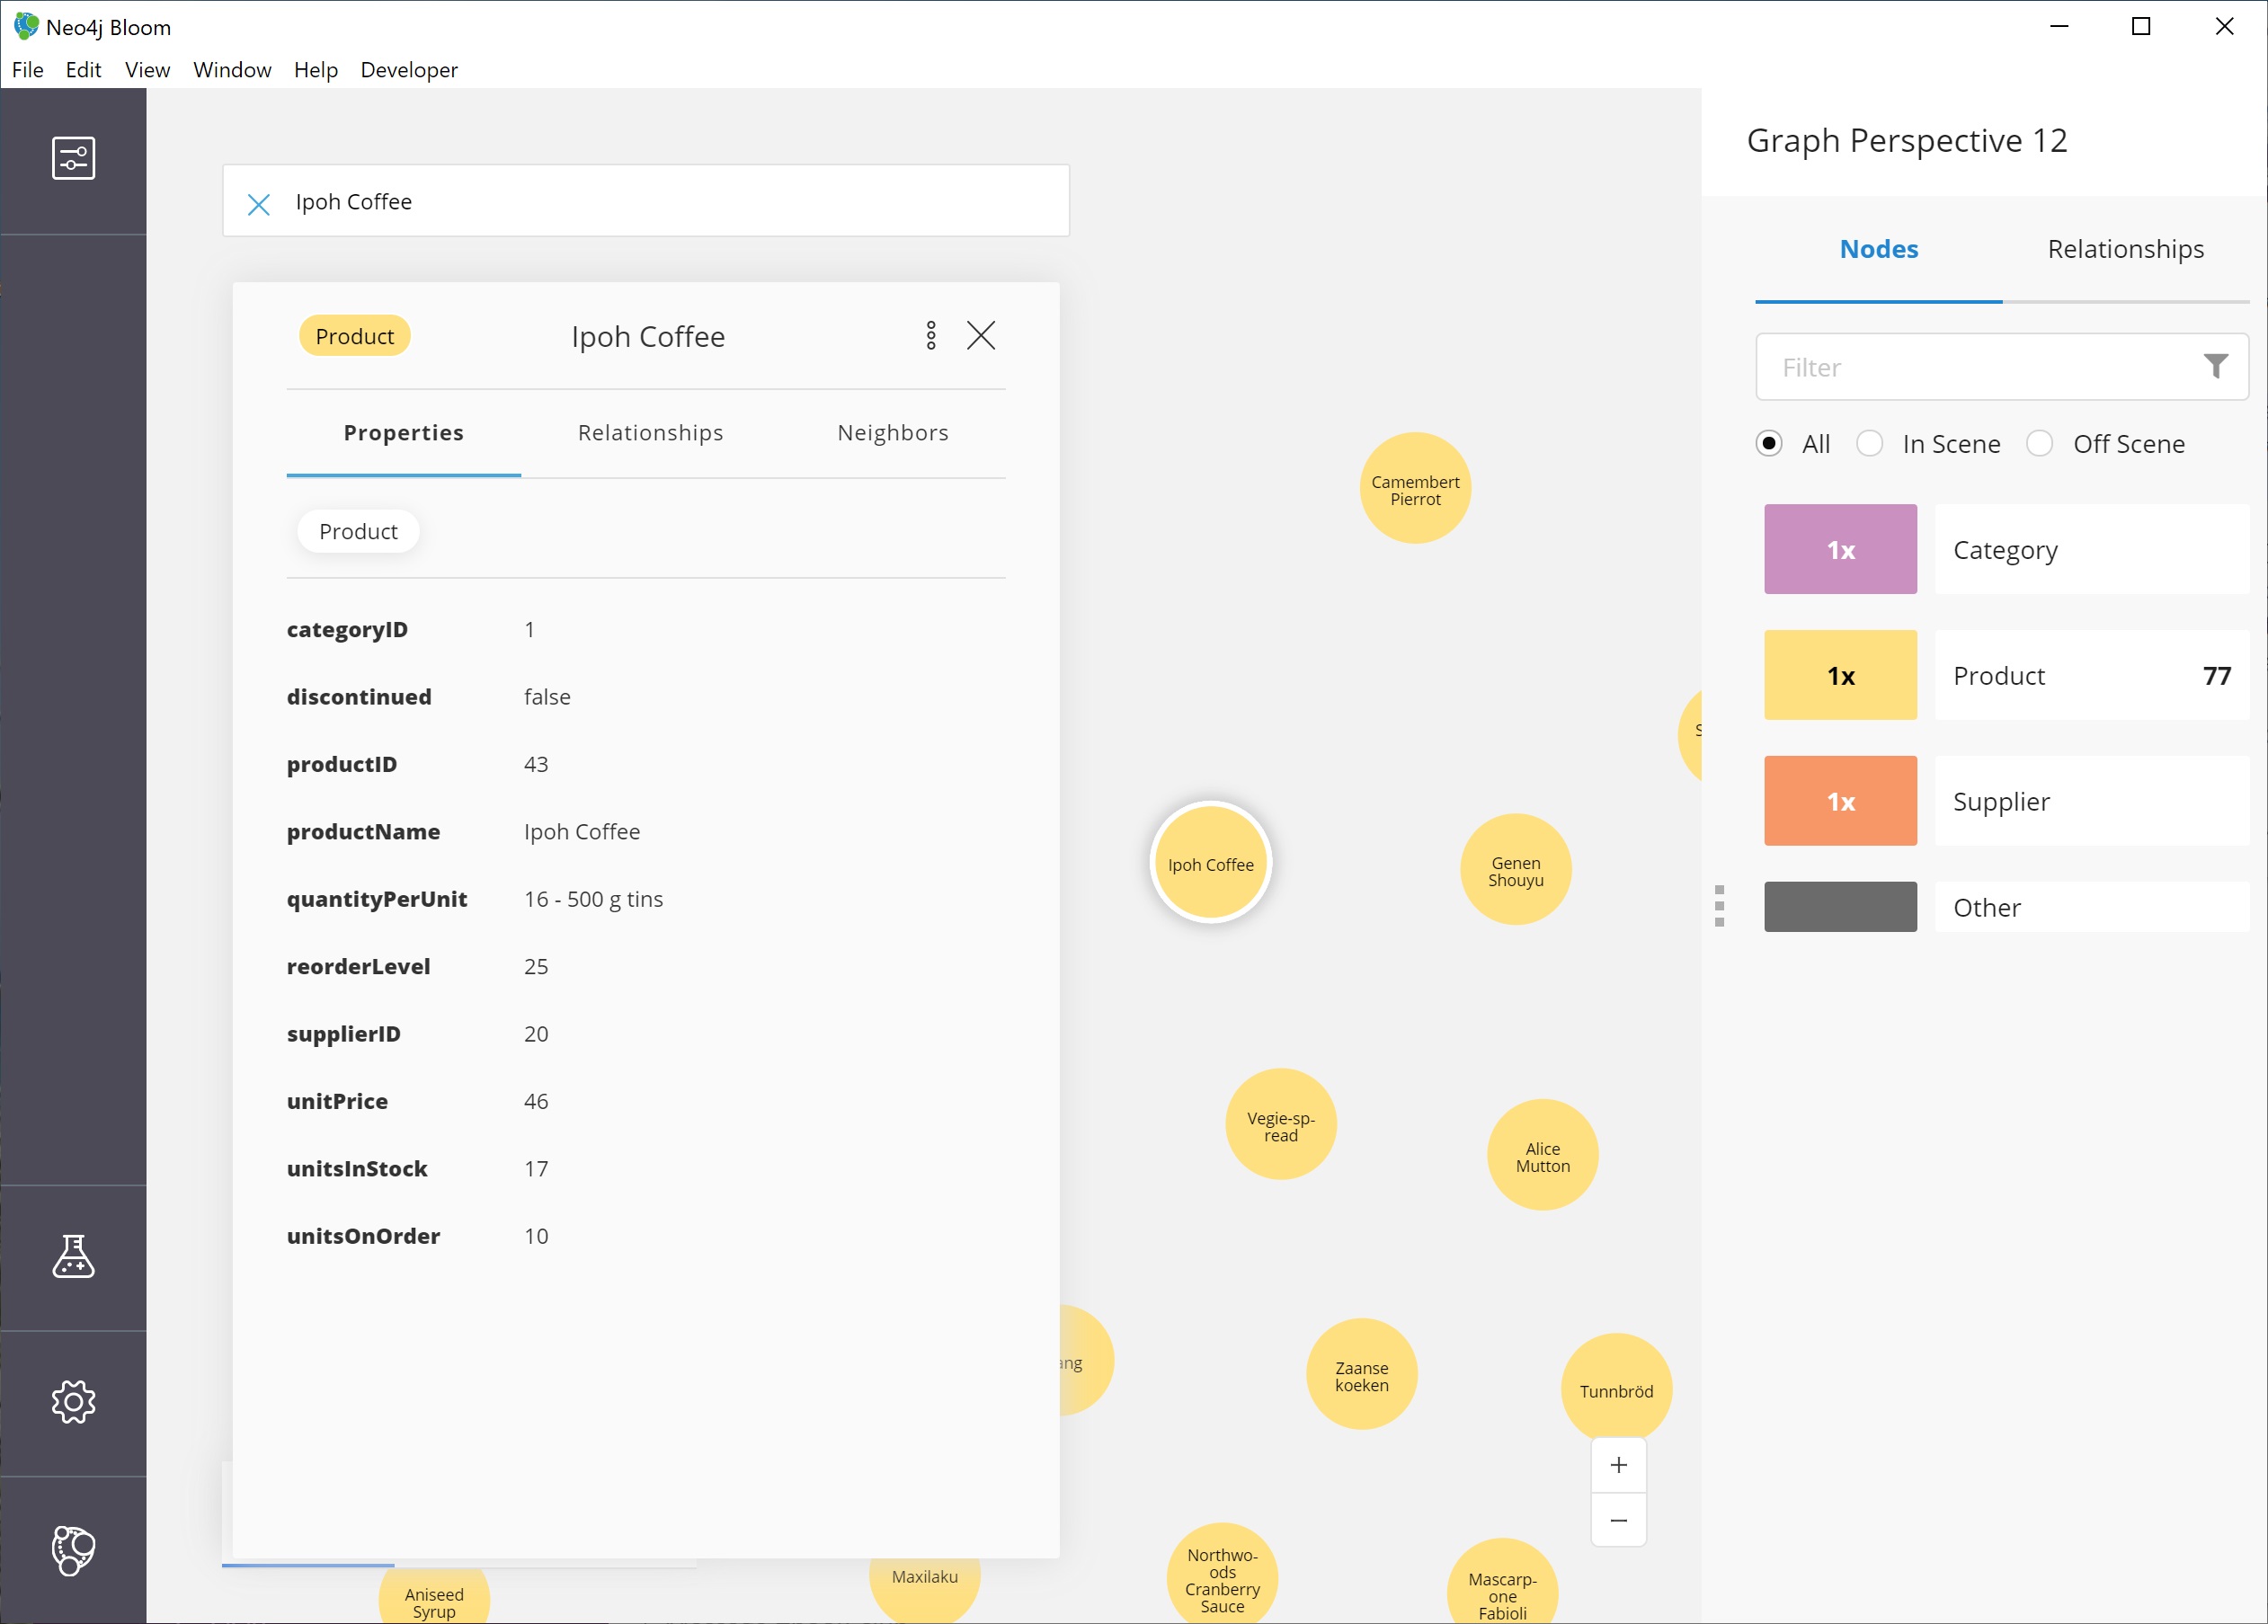
Finally, we can verify that everything worked by closing the perspective panel and looking at our scene again.
The Product nodes should have adjusted to show the product name, rather than the id.
Expanding nodes
Now that we tried a small search and altered the perspective, let us see how Bloom allows us to expand results without writing a different search.
Using our previous search for the Product nodes, we had one node selected to view its properties.
|
If you are starting in the middle of this guide…
You can open Bloom and type |
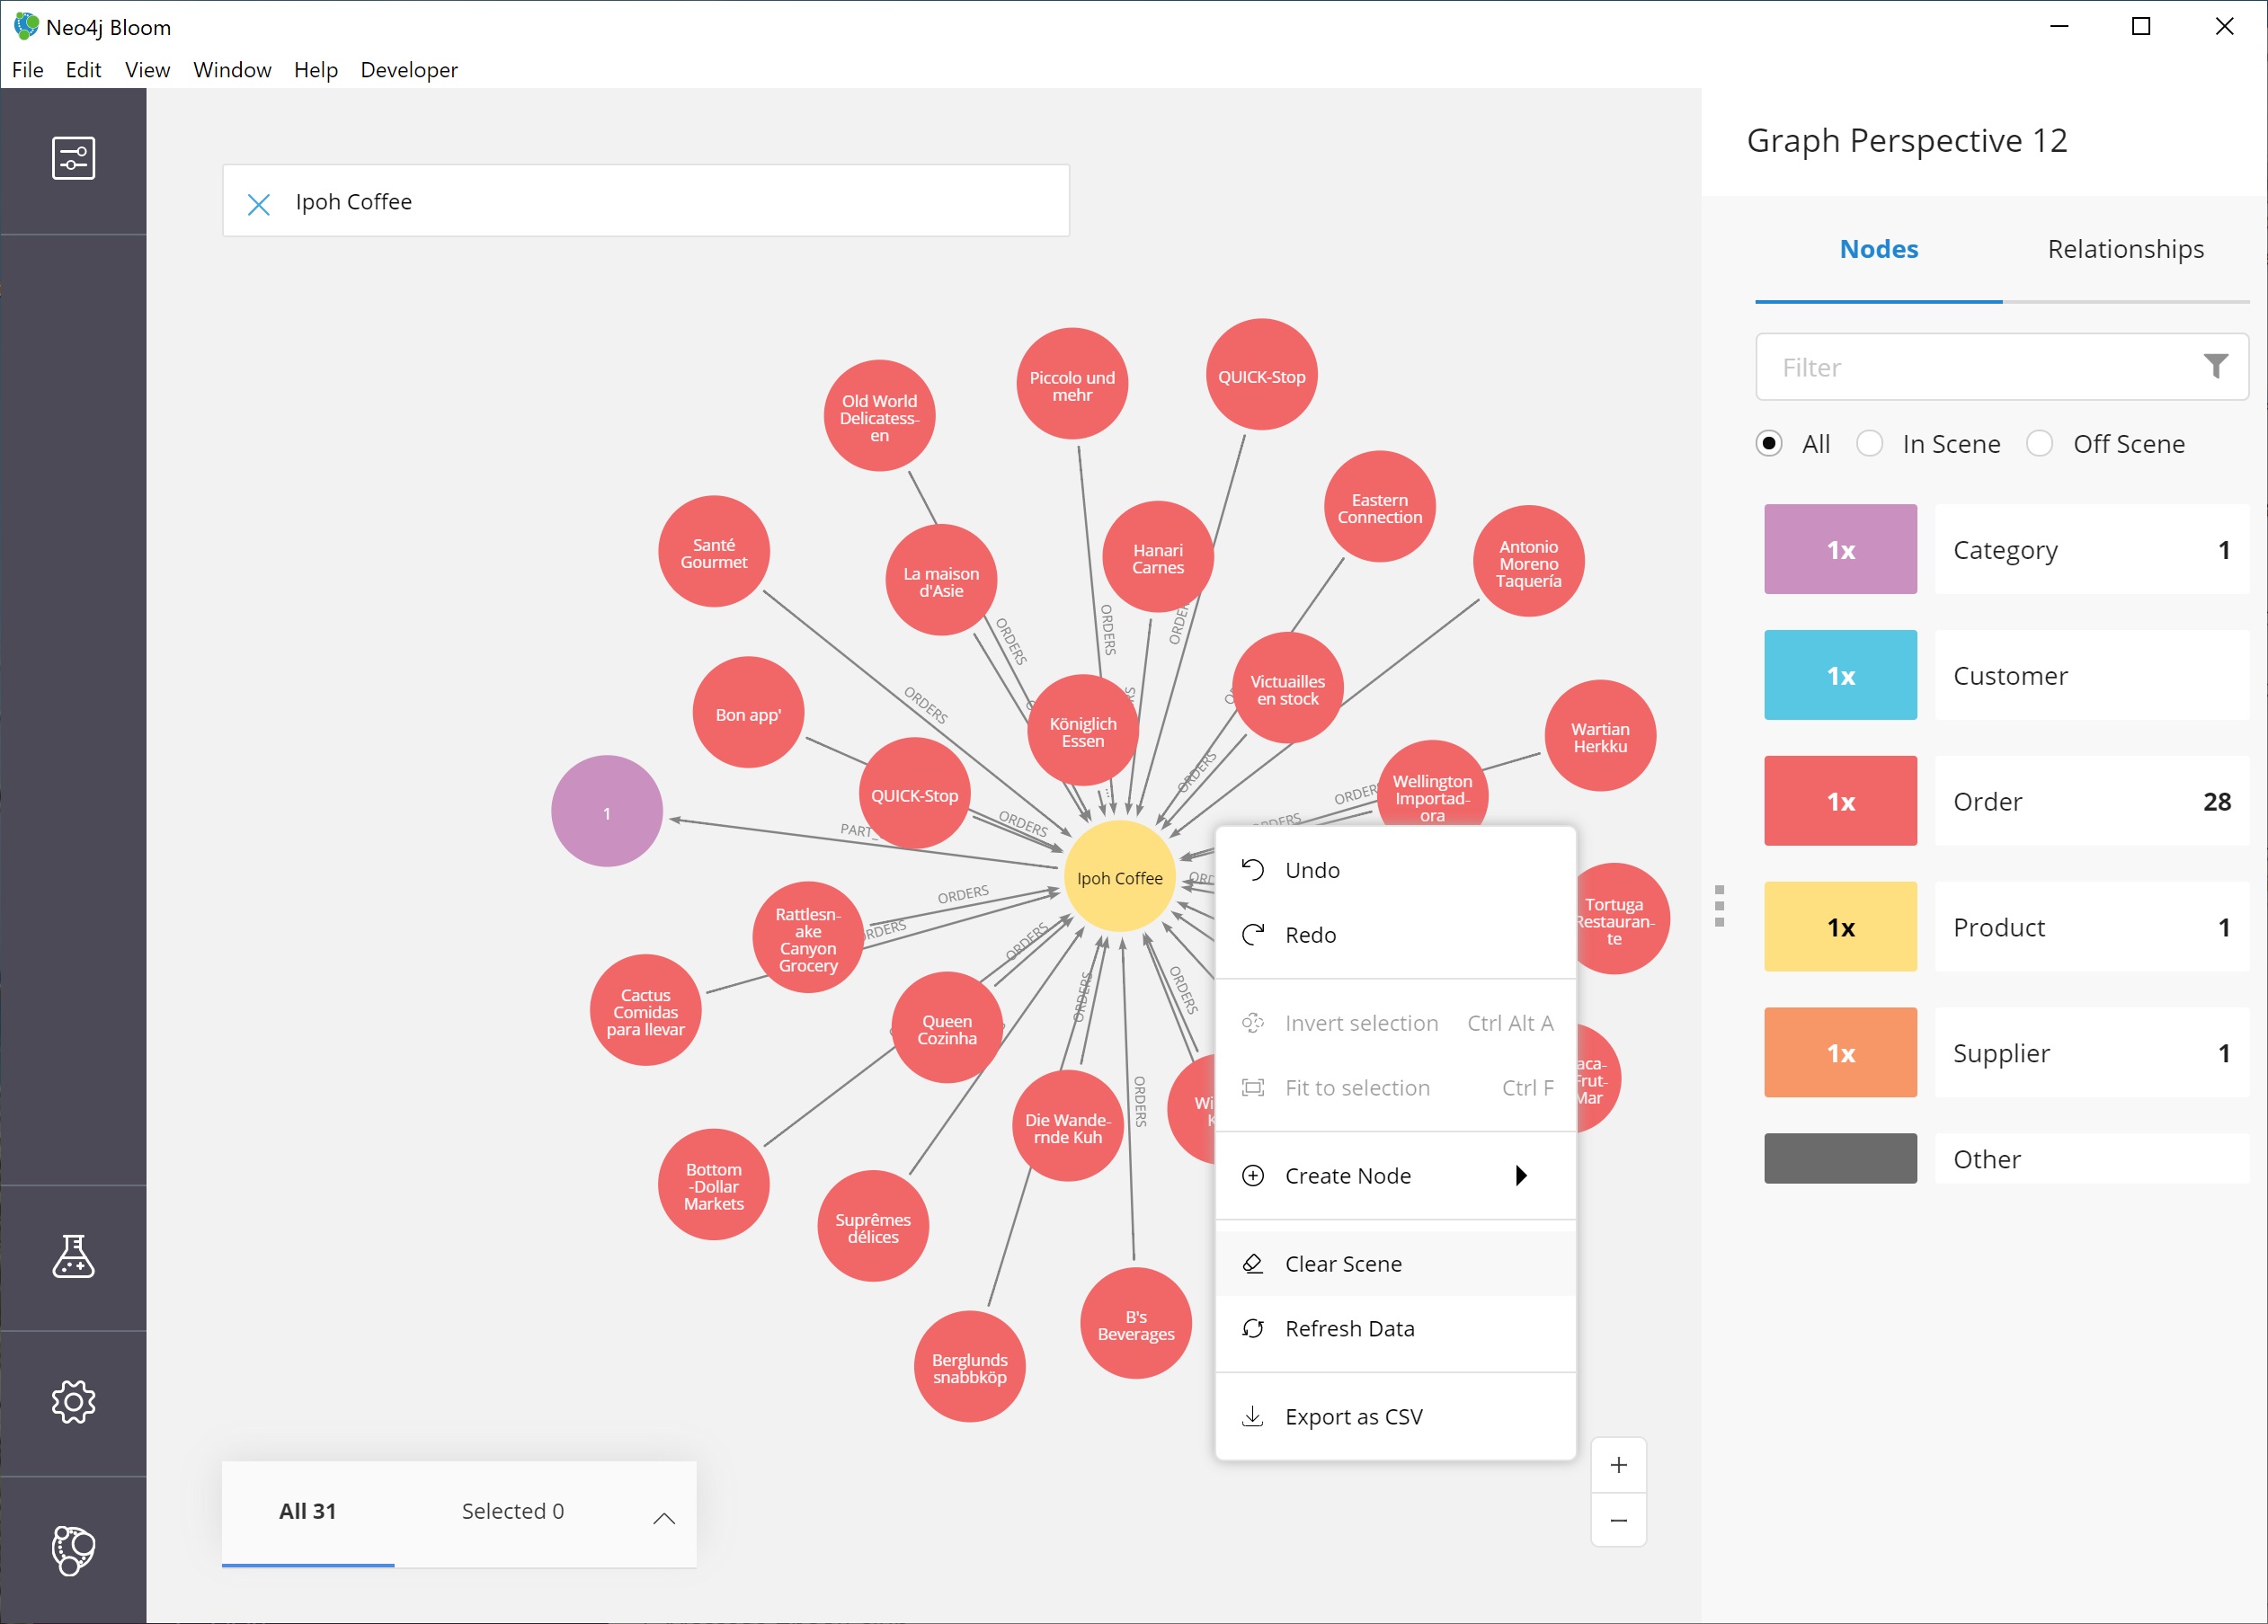
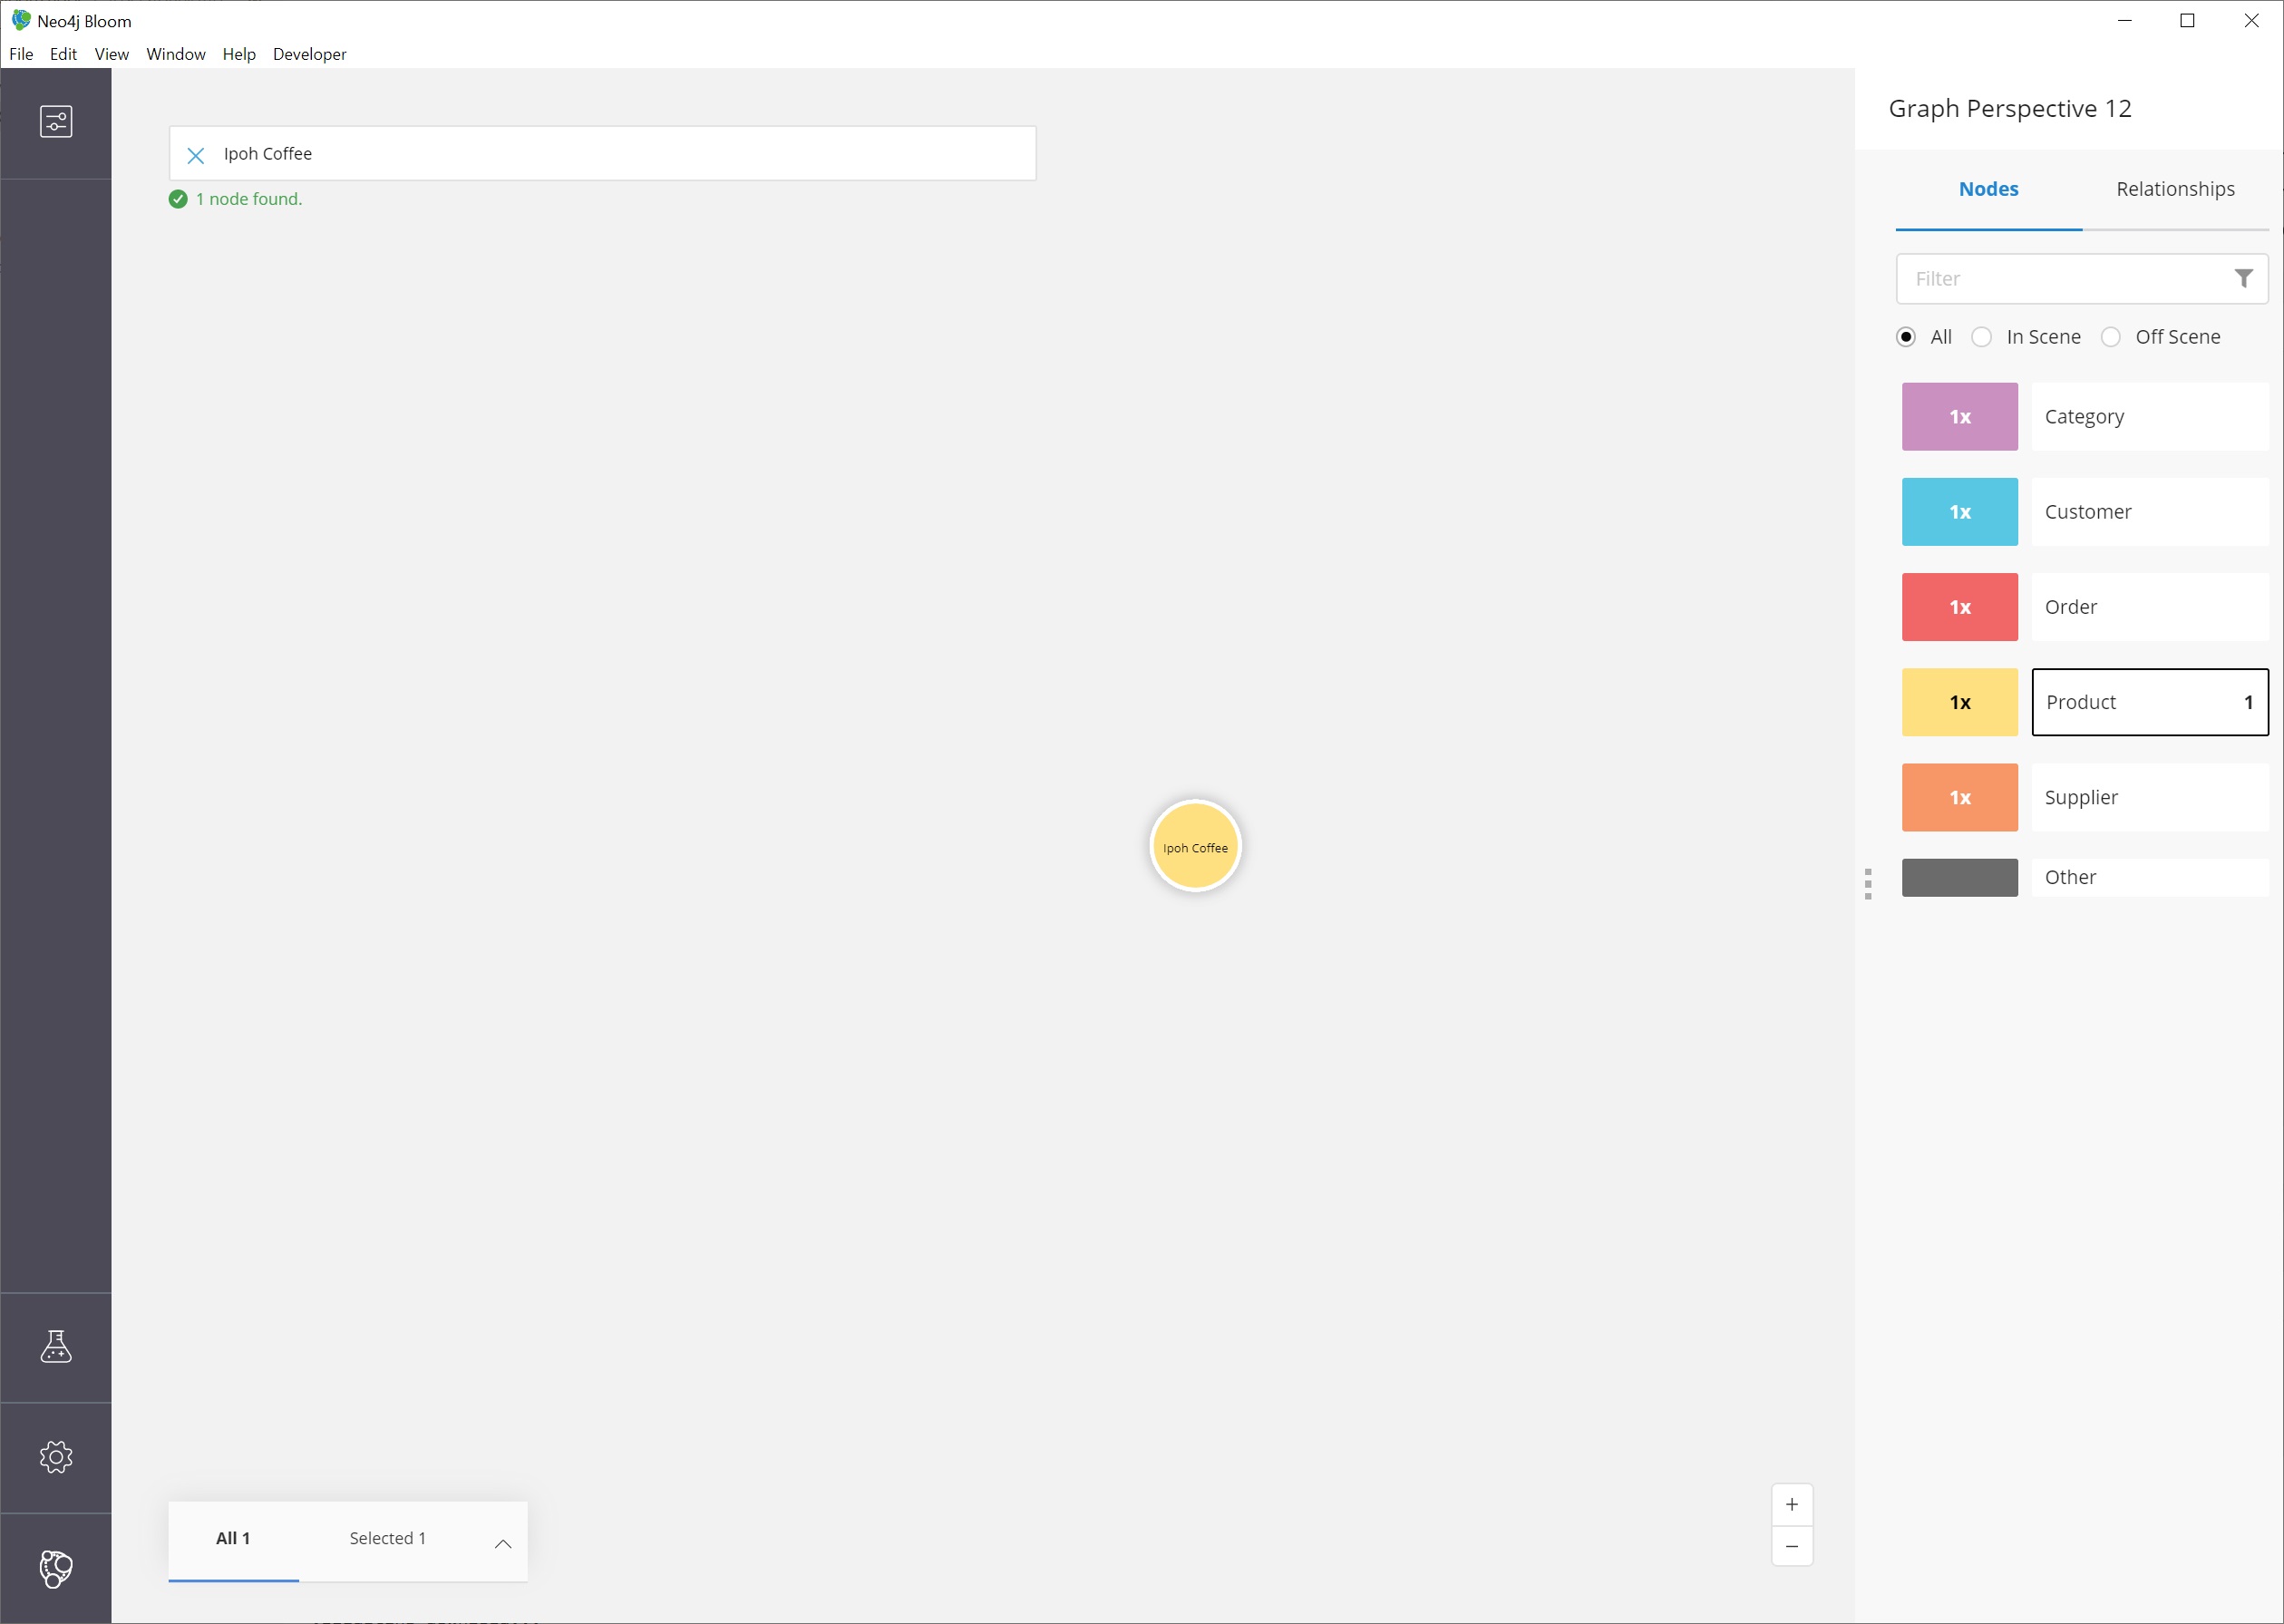
If we have more than one node selected, then we can click in a blank part of the scene to unselect everything, then click on the node we are interested in viewing.
Now, let us clear out all the other nodes that we are not interested in exploring, so we can focus on this node. To do that, we can right-mouse click (keyboard:`ctrl/cmd key + click`) on the selected node, which opens an option menu.
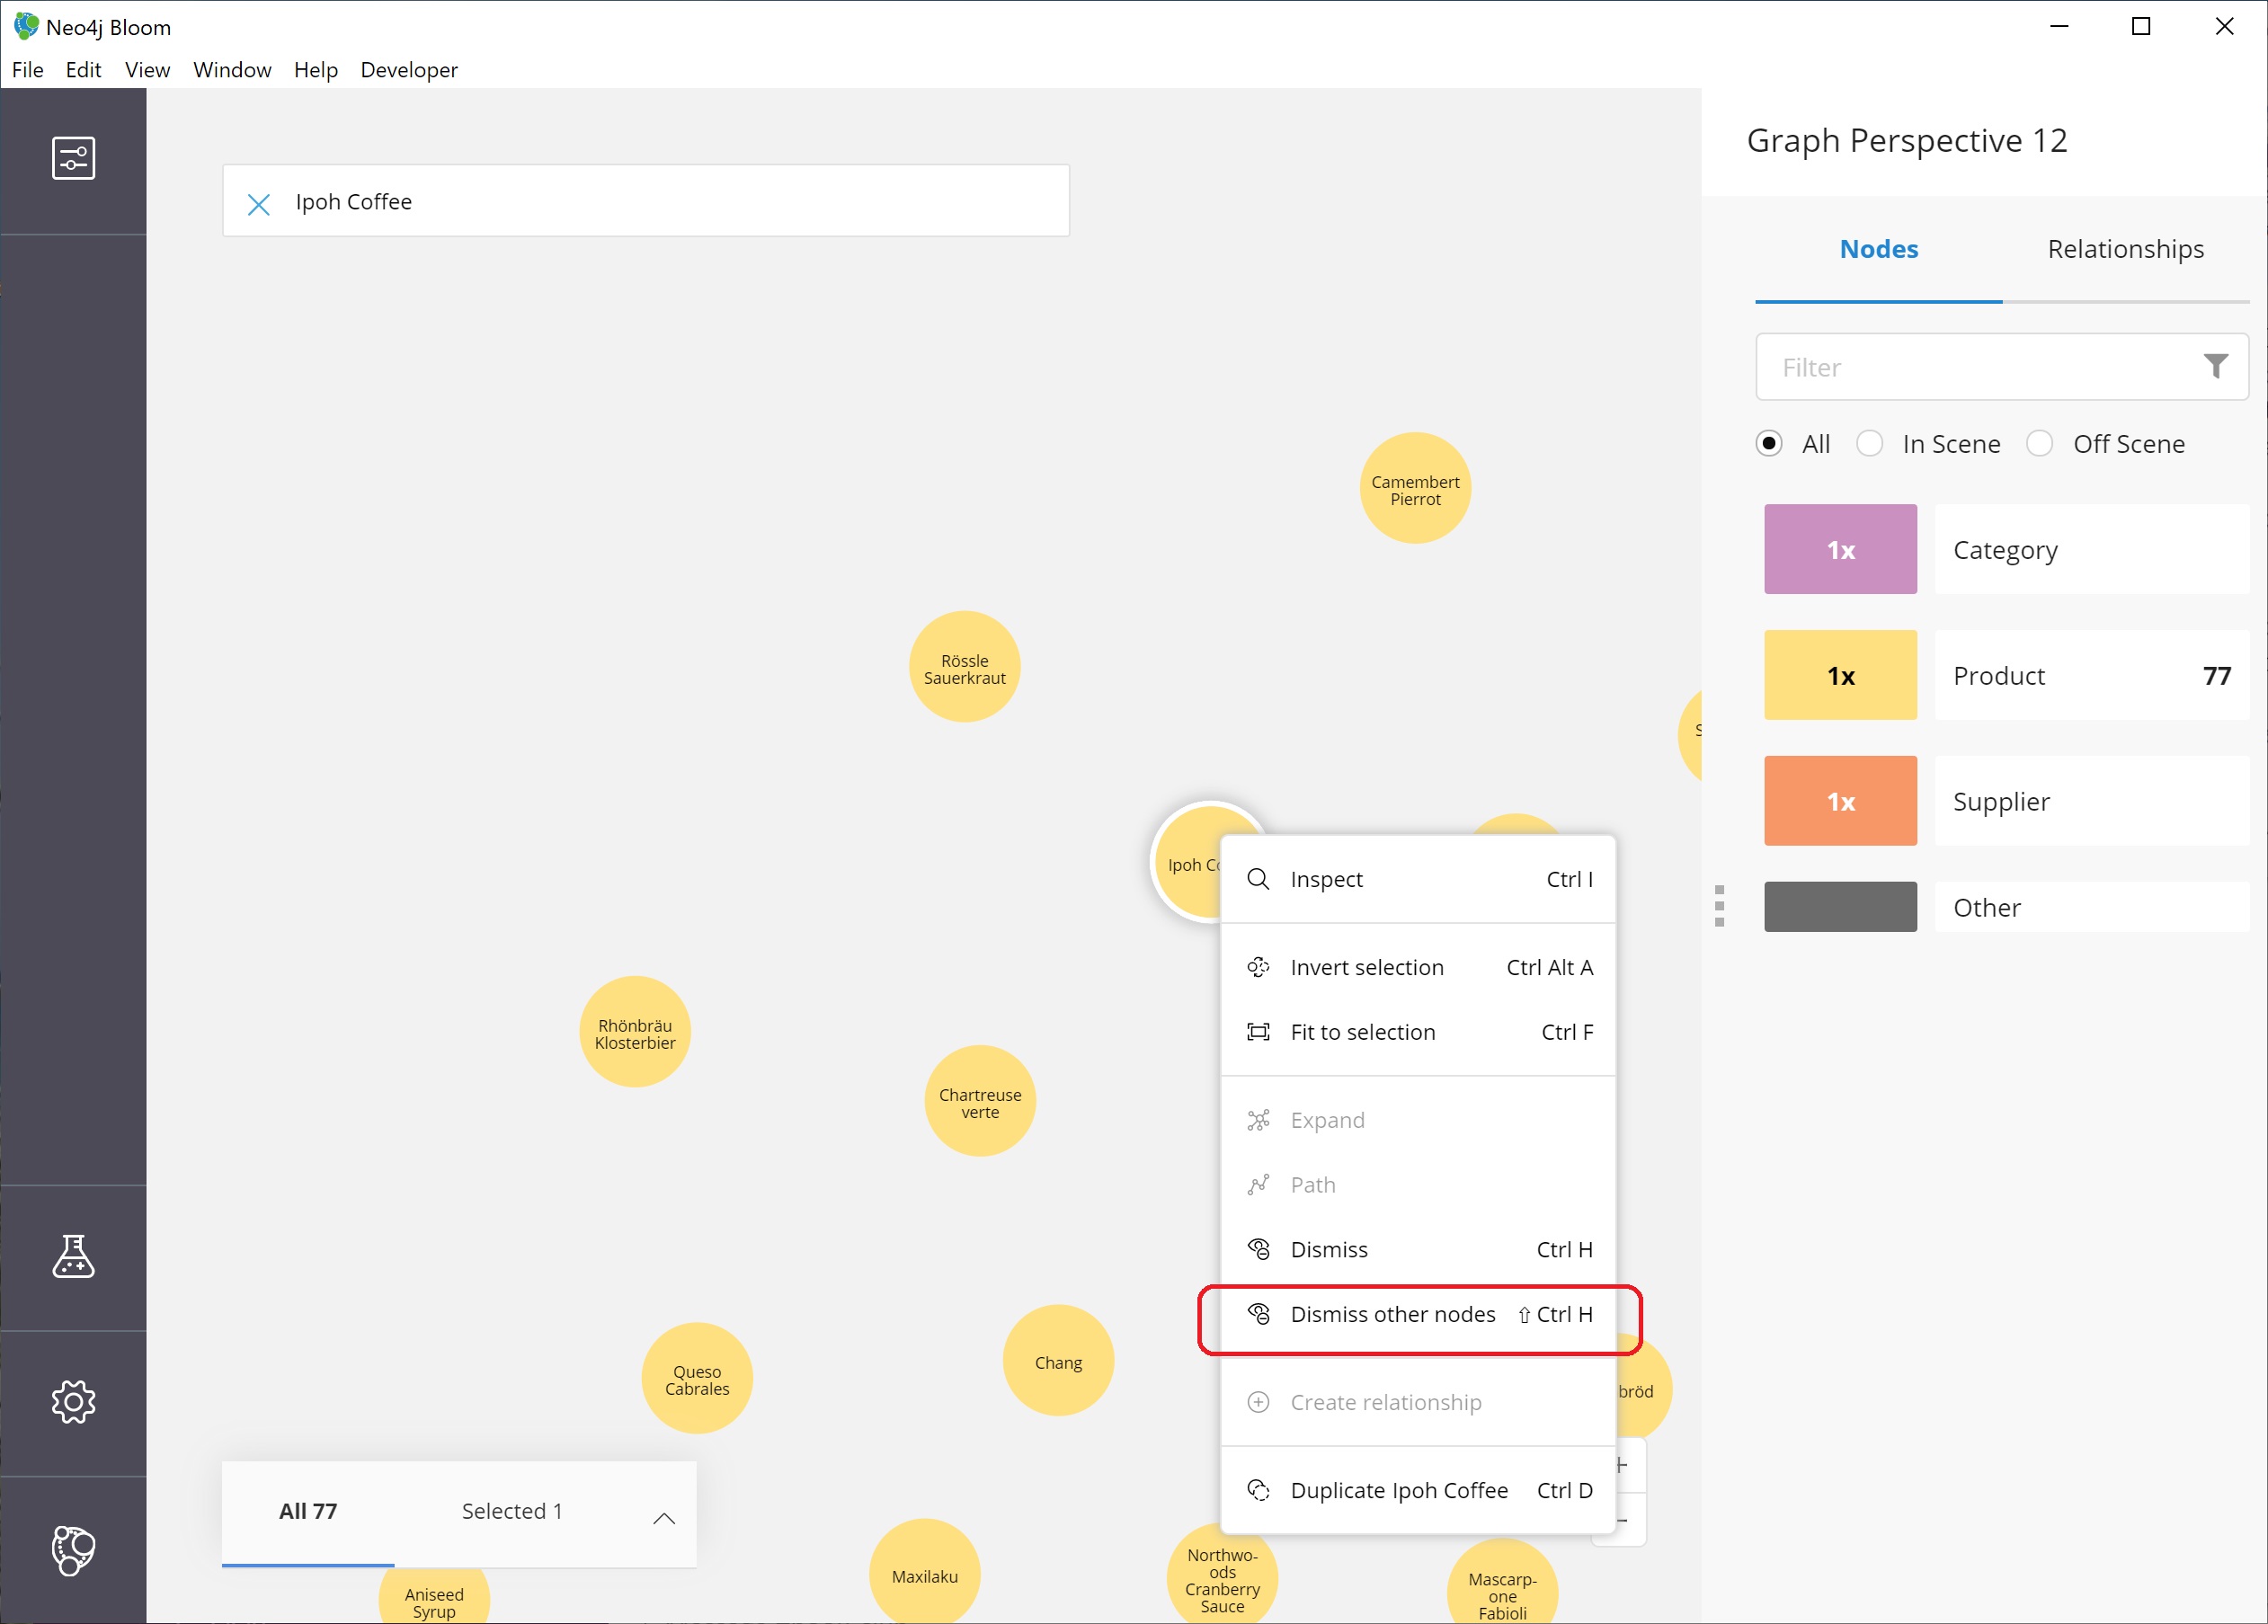
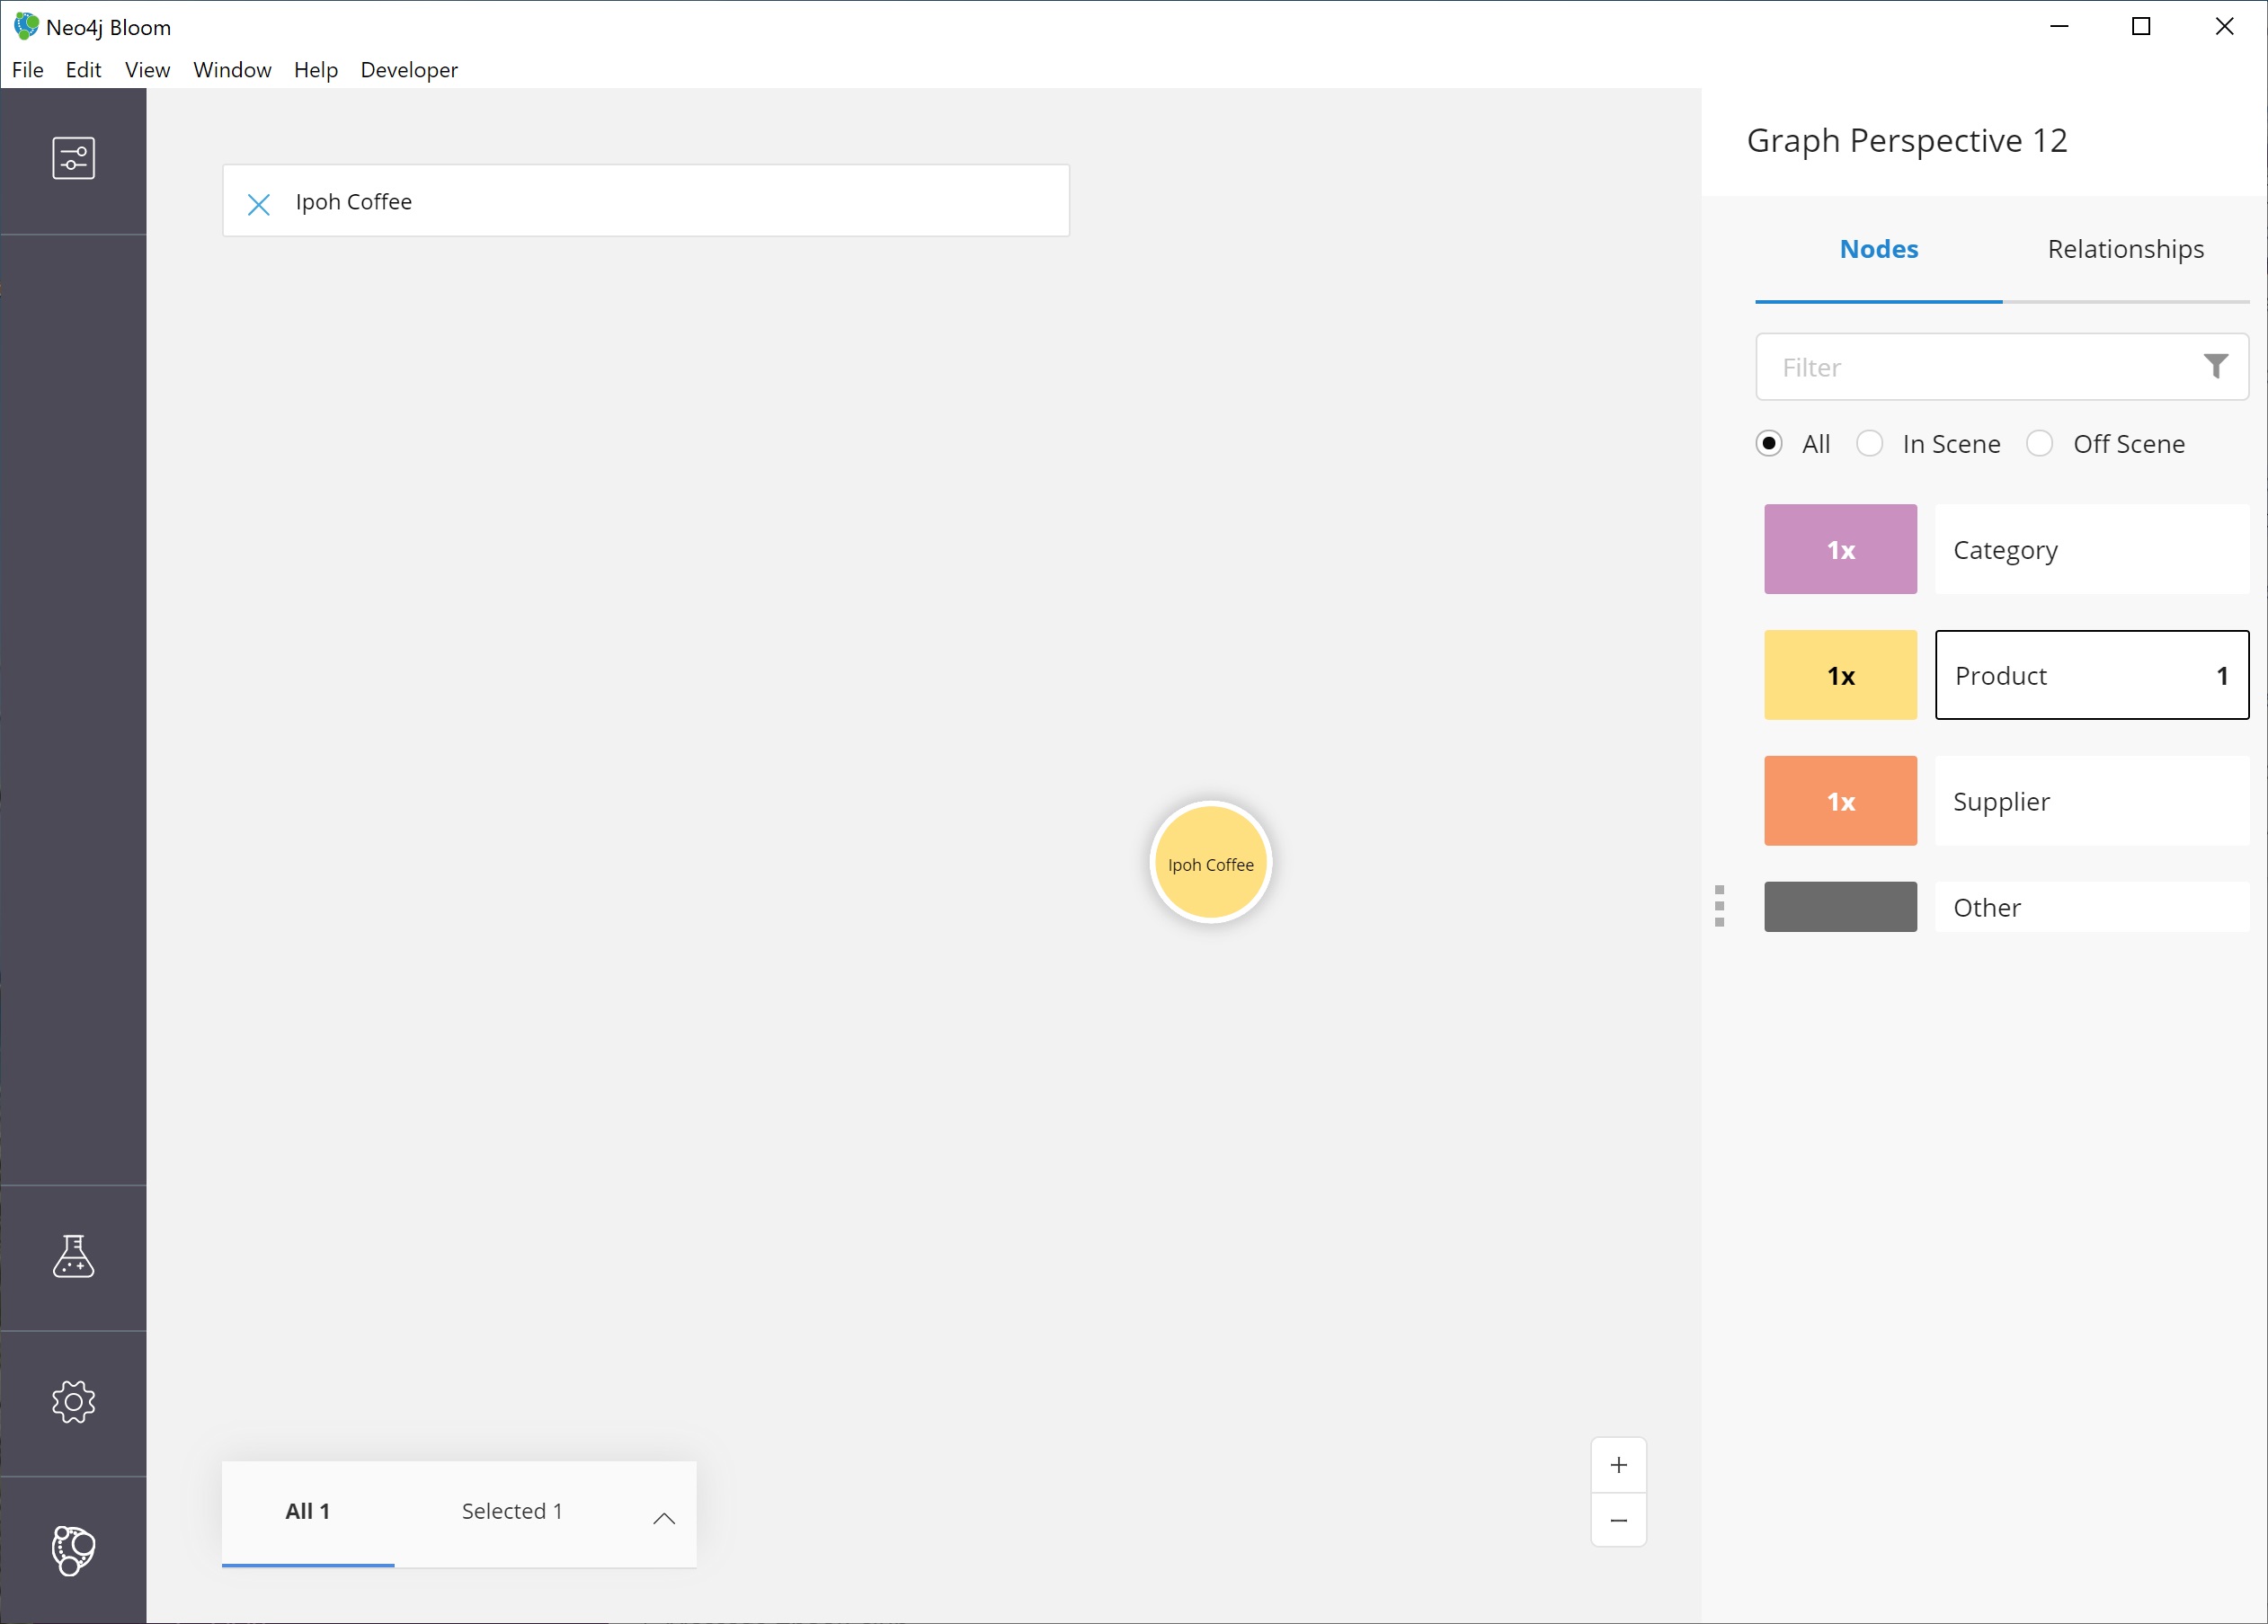
We choose the Dismiss other nodes option from the list, and the other nodes (except our Ipoh Coffee) node should disappear from our scene.
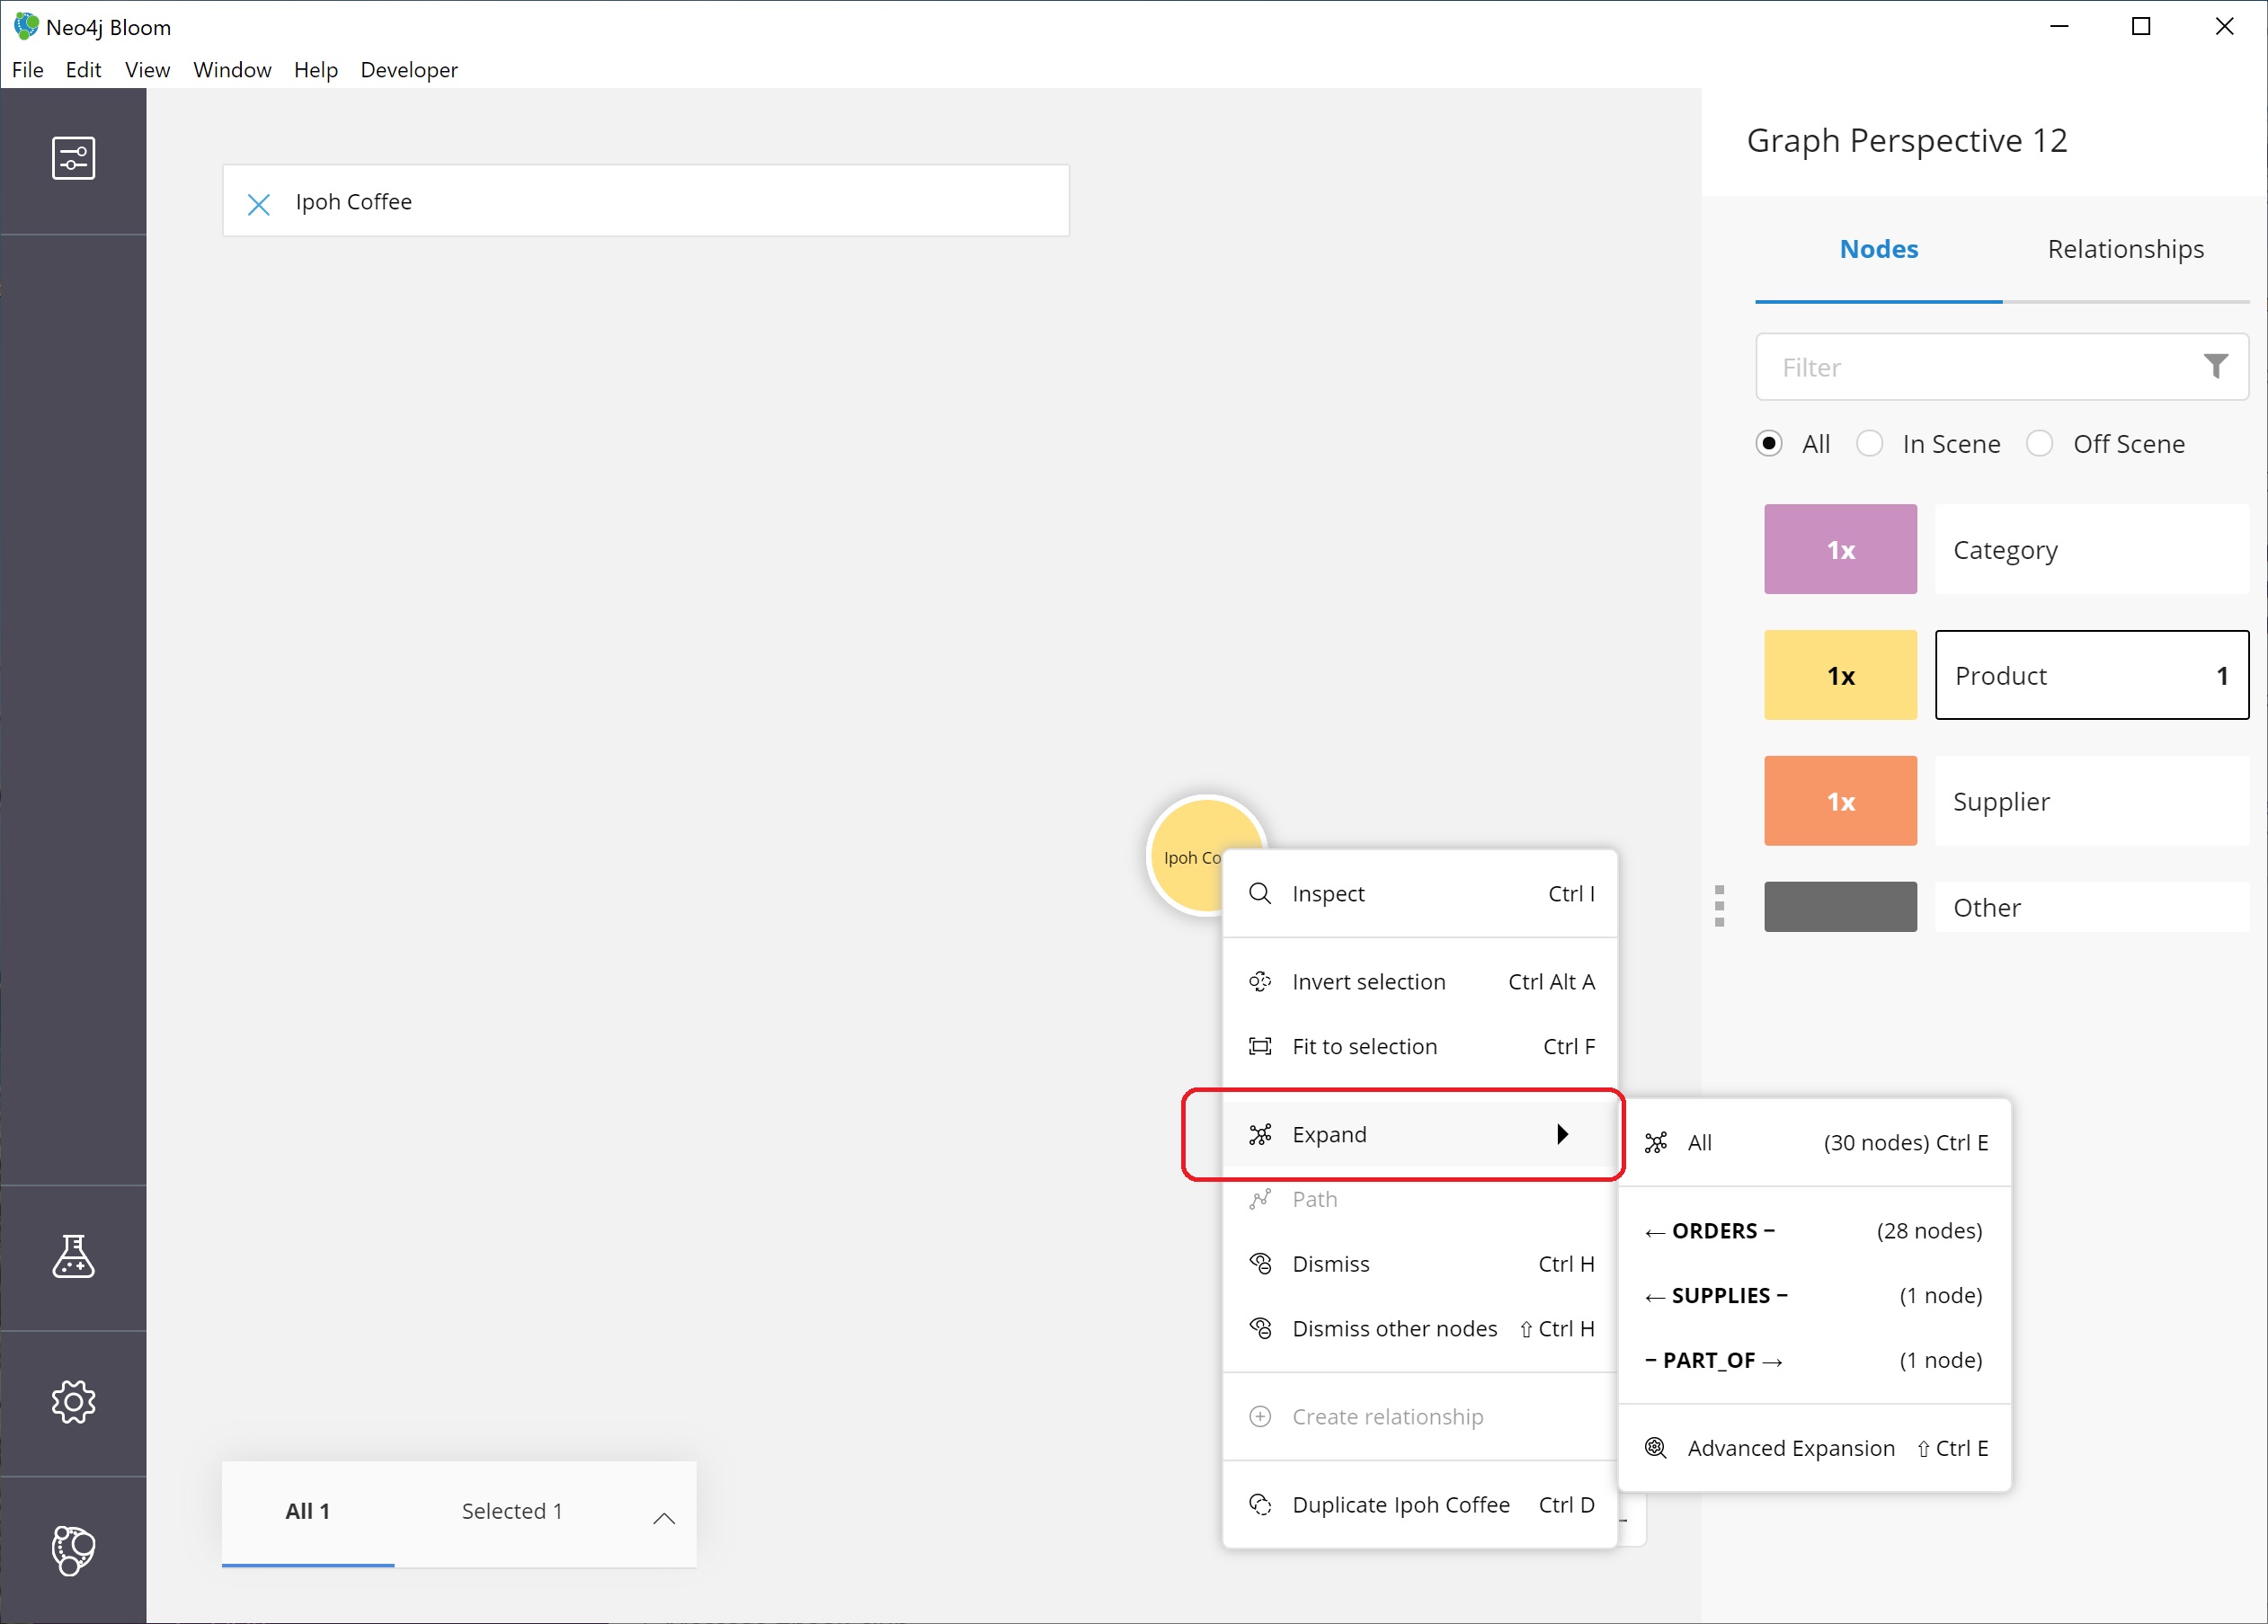
Next, we can expand this node to see all of the relationships it has with other nodes.
We right-click (keyboard:`ctrl/cmd key + click`) on the node to bring up the option menu again, then choose Expand. You can either expand by a specific relationship type, or you can expand all of the relationships.
You also see the number of nodes it will add to the scene in that option, so we know how much data we are adding and how many connections the node has. Select All.
We should now see a small graph around the product node of all of the relationships and nodes it is connected to. All of the nodes match the colors from the legend, so we have some red nodes that are orders (28 of those), an orange node that is a supplier (1 of those), and a category node that is a product category (1 of those).
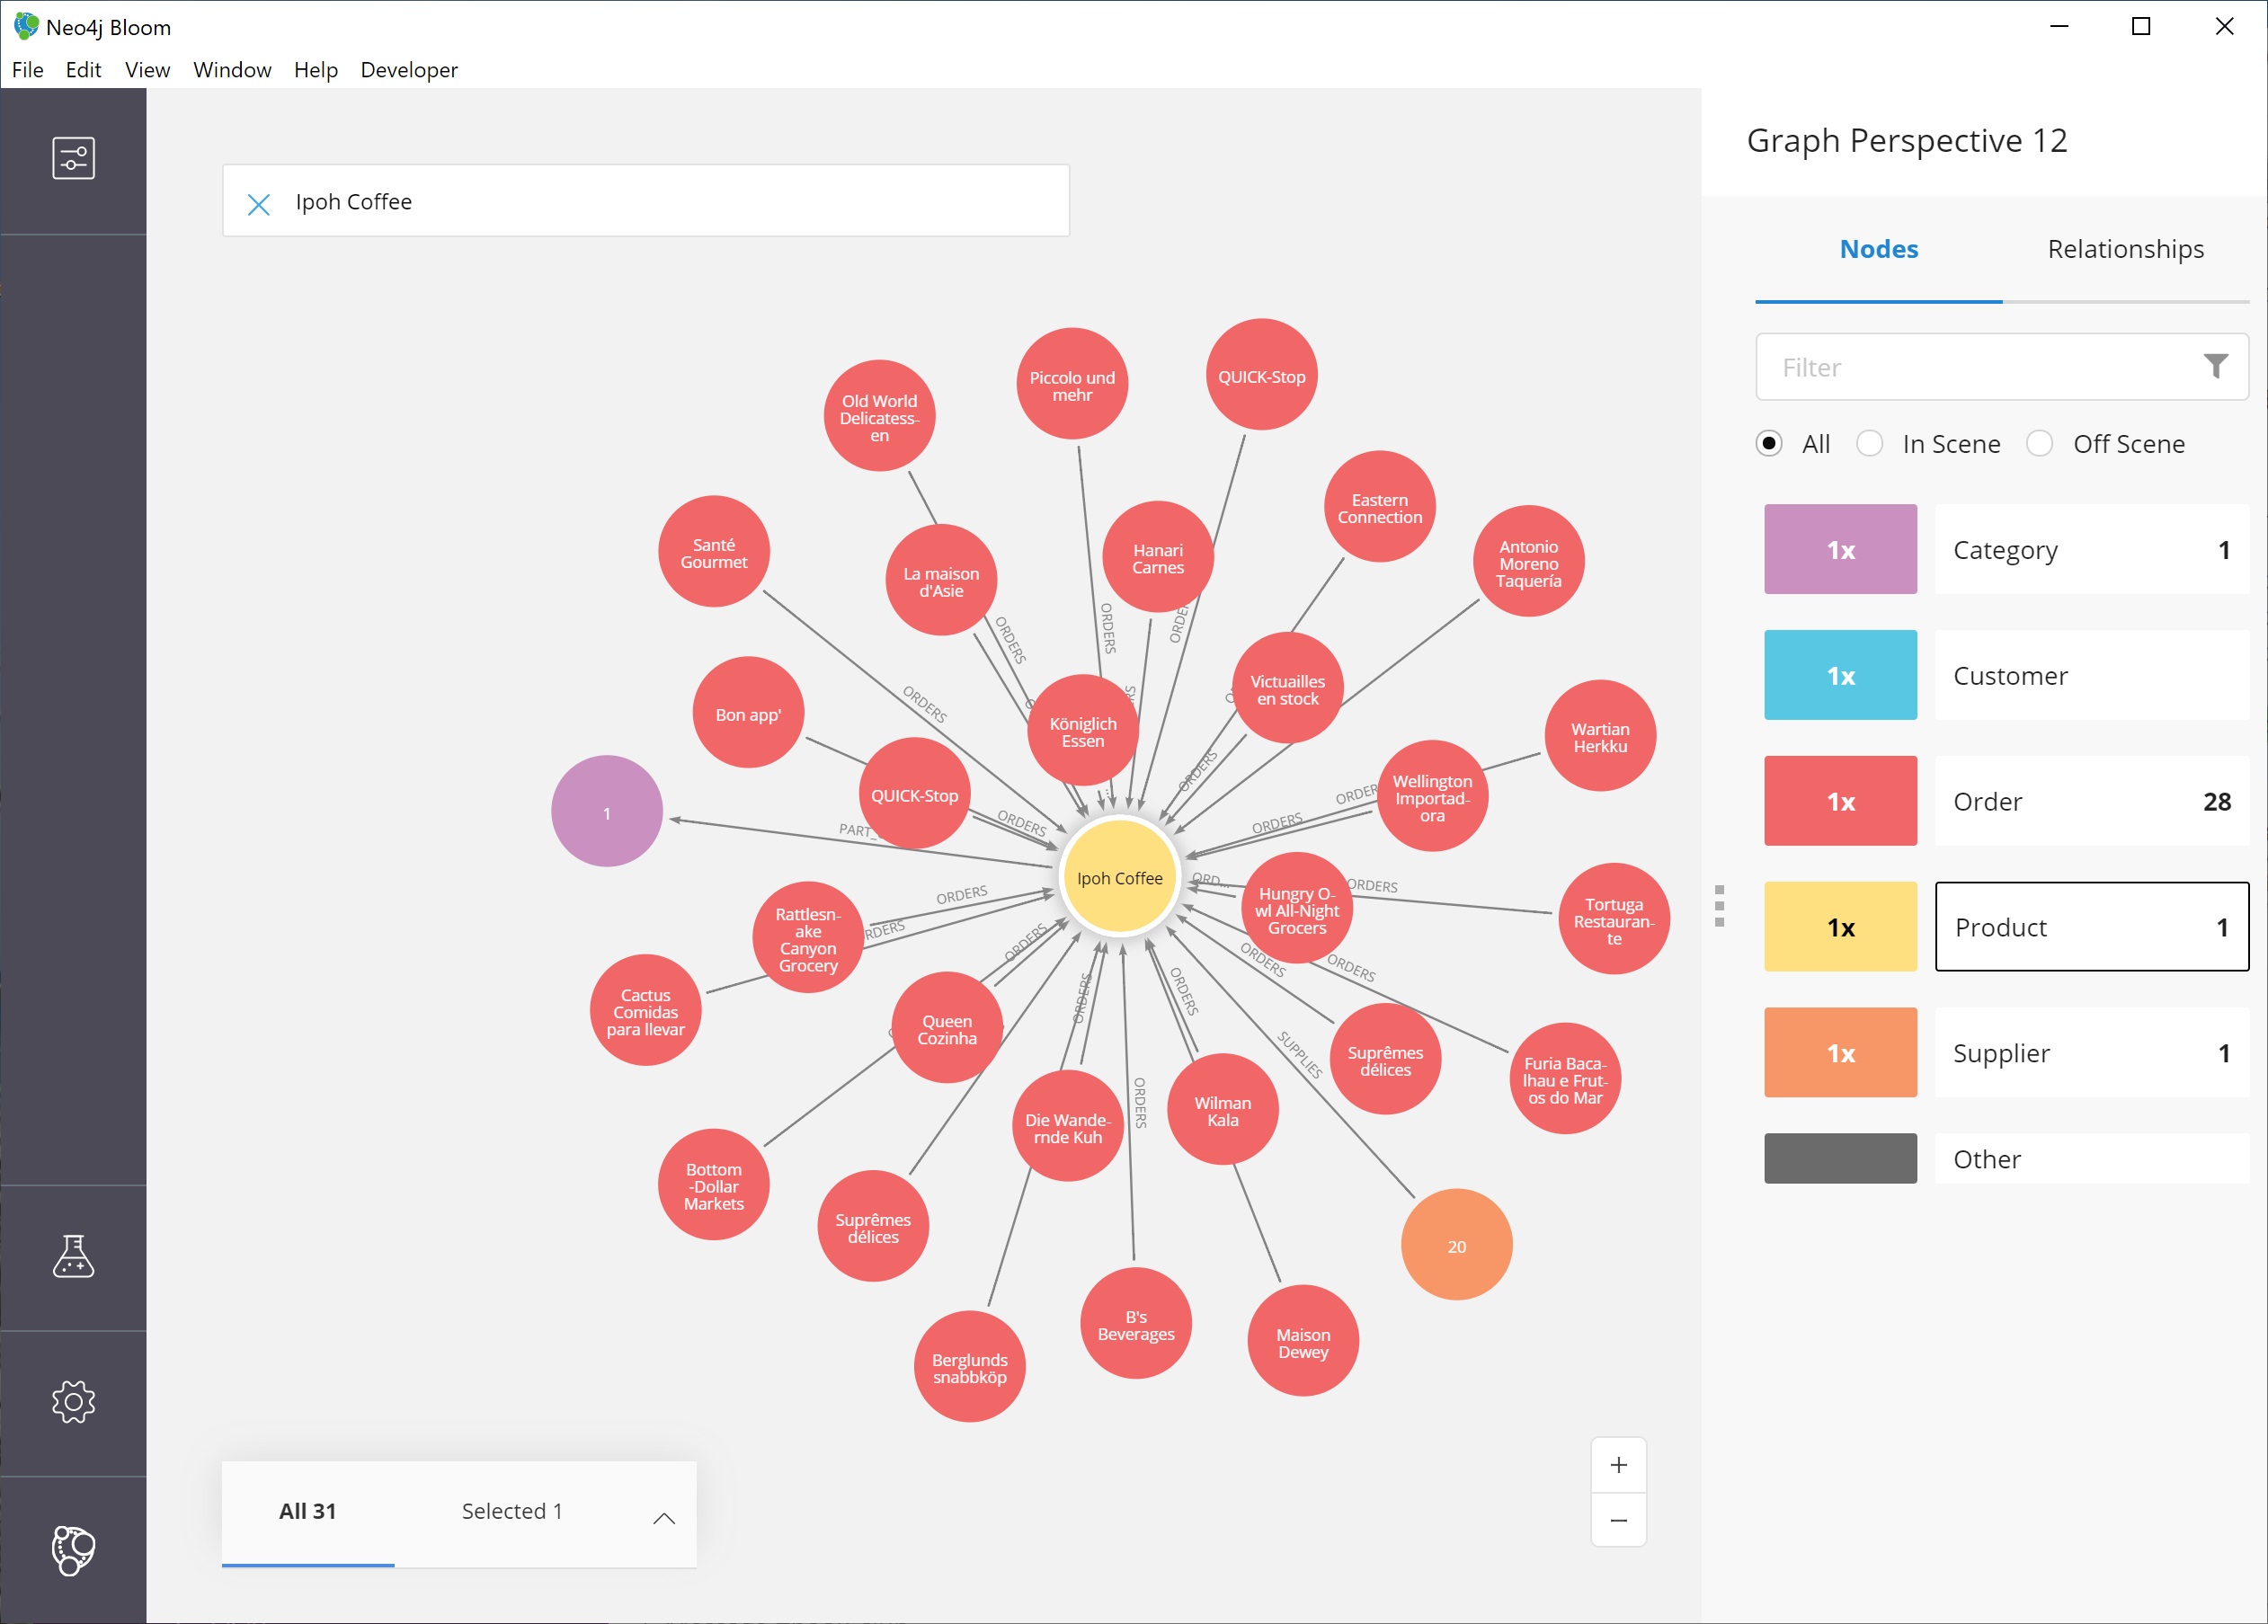
The scene also shows ids for each one of these nodes, so we can refer to our earlier step for altering the perspective to view other properties for the categories.
|
Taking it further…
you can continue to explore this section of the graph by expanding the |
Clearing data in Neo4j Bloom
As we explore data with Neo4j Bloom, it continues to add more data to the scene and not remove it (unless we dismiss nodes using each node’s option menu). However, there is a way to clear the whole scene and start with a blank slate so we can run different queries or explore other parts of the graph without previous results cluttering the view.
To do this, we can right-mouse click (keyboard:`ctrl/cmd key + click`) in a blank spot of the scene to bring up the scene menu and choose the Clear Scene option from the list.
This will bring us back to an empty scene.
Searching patterns
Similar to how we searched for products earlier in this guide, we can also search for more complex patterns.
We can take it one step further by looking for suppliers who supply more than one product.
To search for this in Bloom, we need to find products that share a supplier, so we can write a palindrome search (search is the same if re-ordered end to beginning).
We can type in the terms below and press the Enter key to find results.
Product Supplier Product
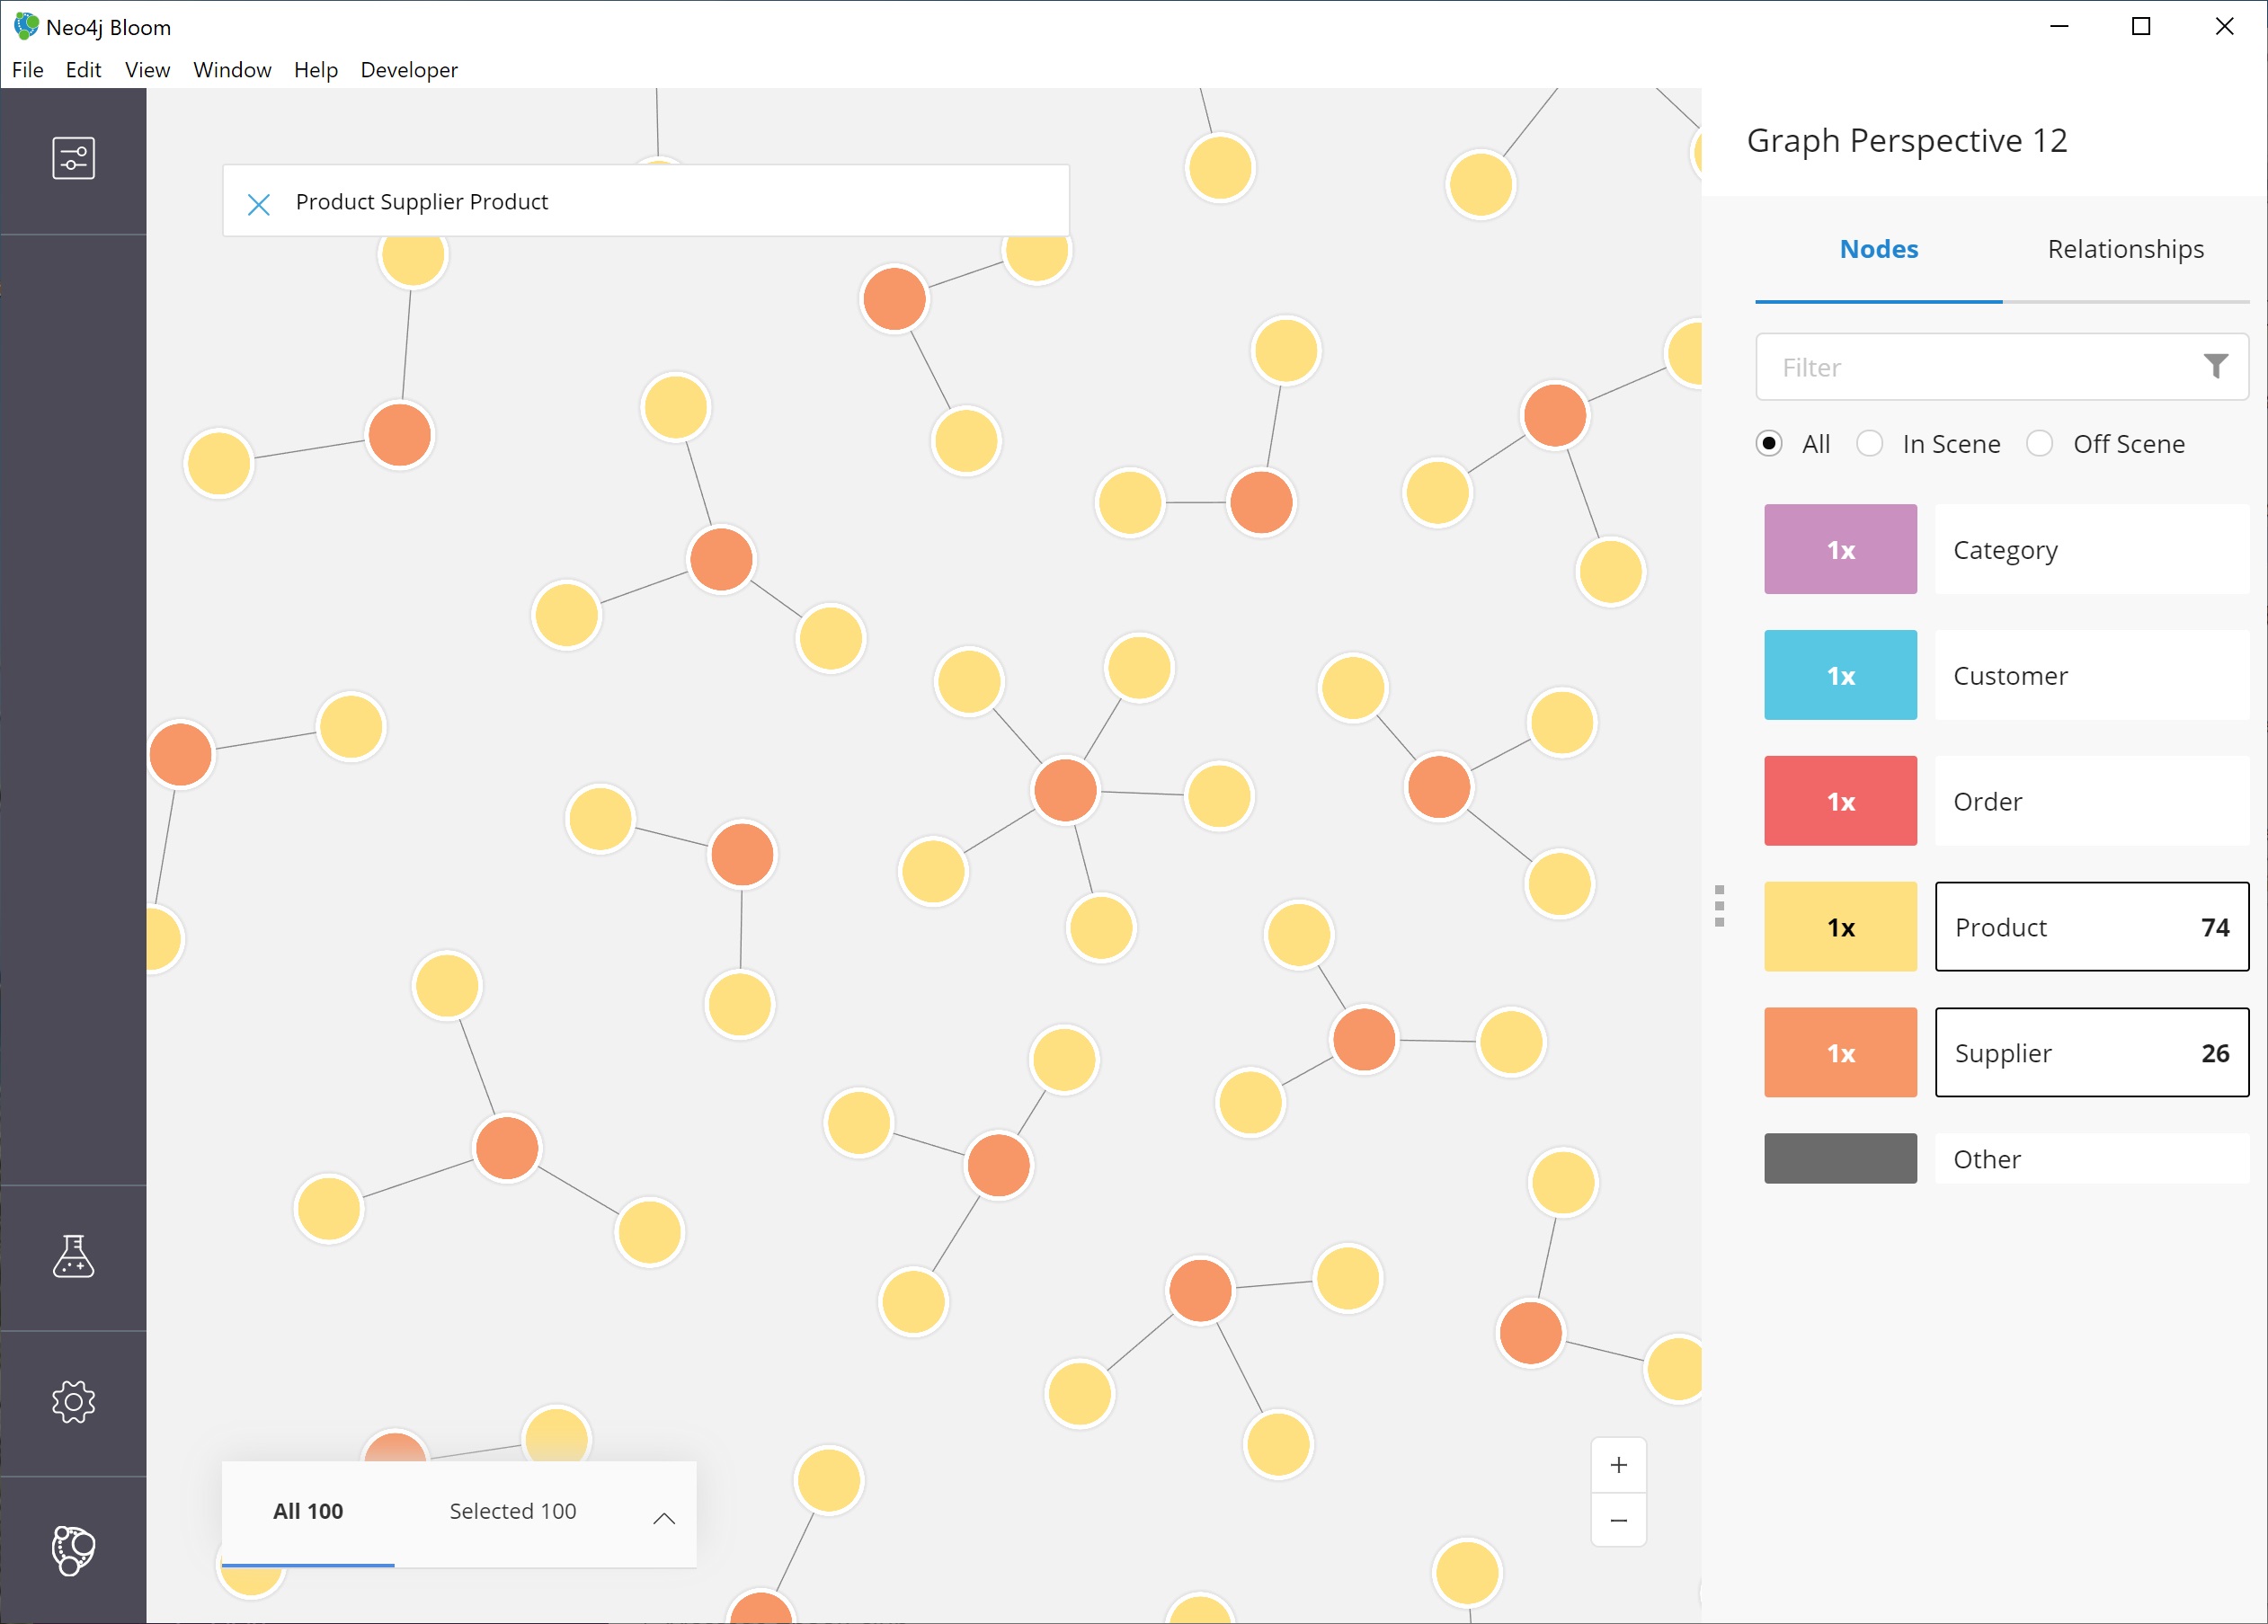
Notice that we didn’t need to specify relationships in our search. Bloom makes suggestions based on what it finds in the graph, so we don’t have to type it out. When picking from the search suggestions, we can choose which relationships are traversed.
We can zoom in a bit and pick out some interesting clusters.
For instance, the supplier Specialty Biscuits supplies four different products, all with a teatime theme (longbreads, chocolate biscuits, scones, and marmalade).
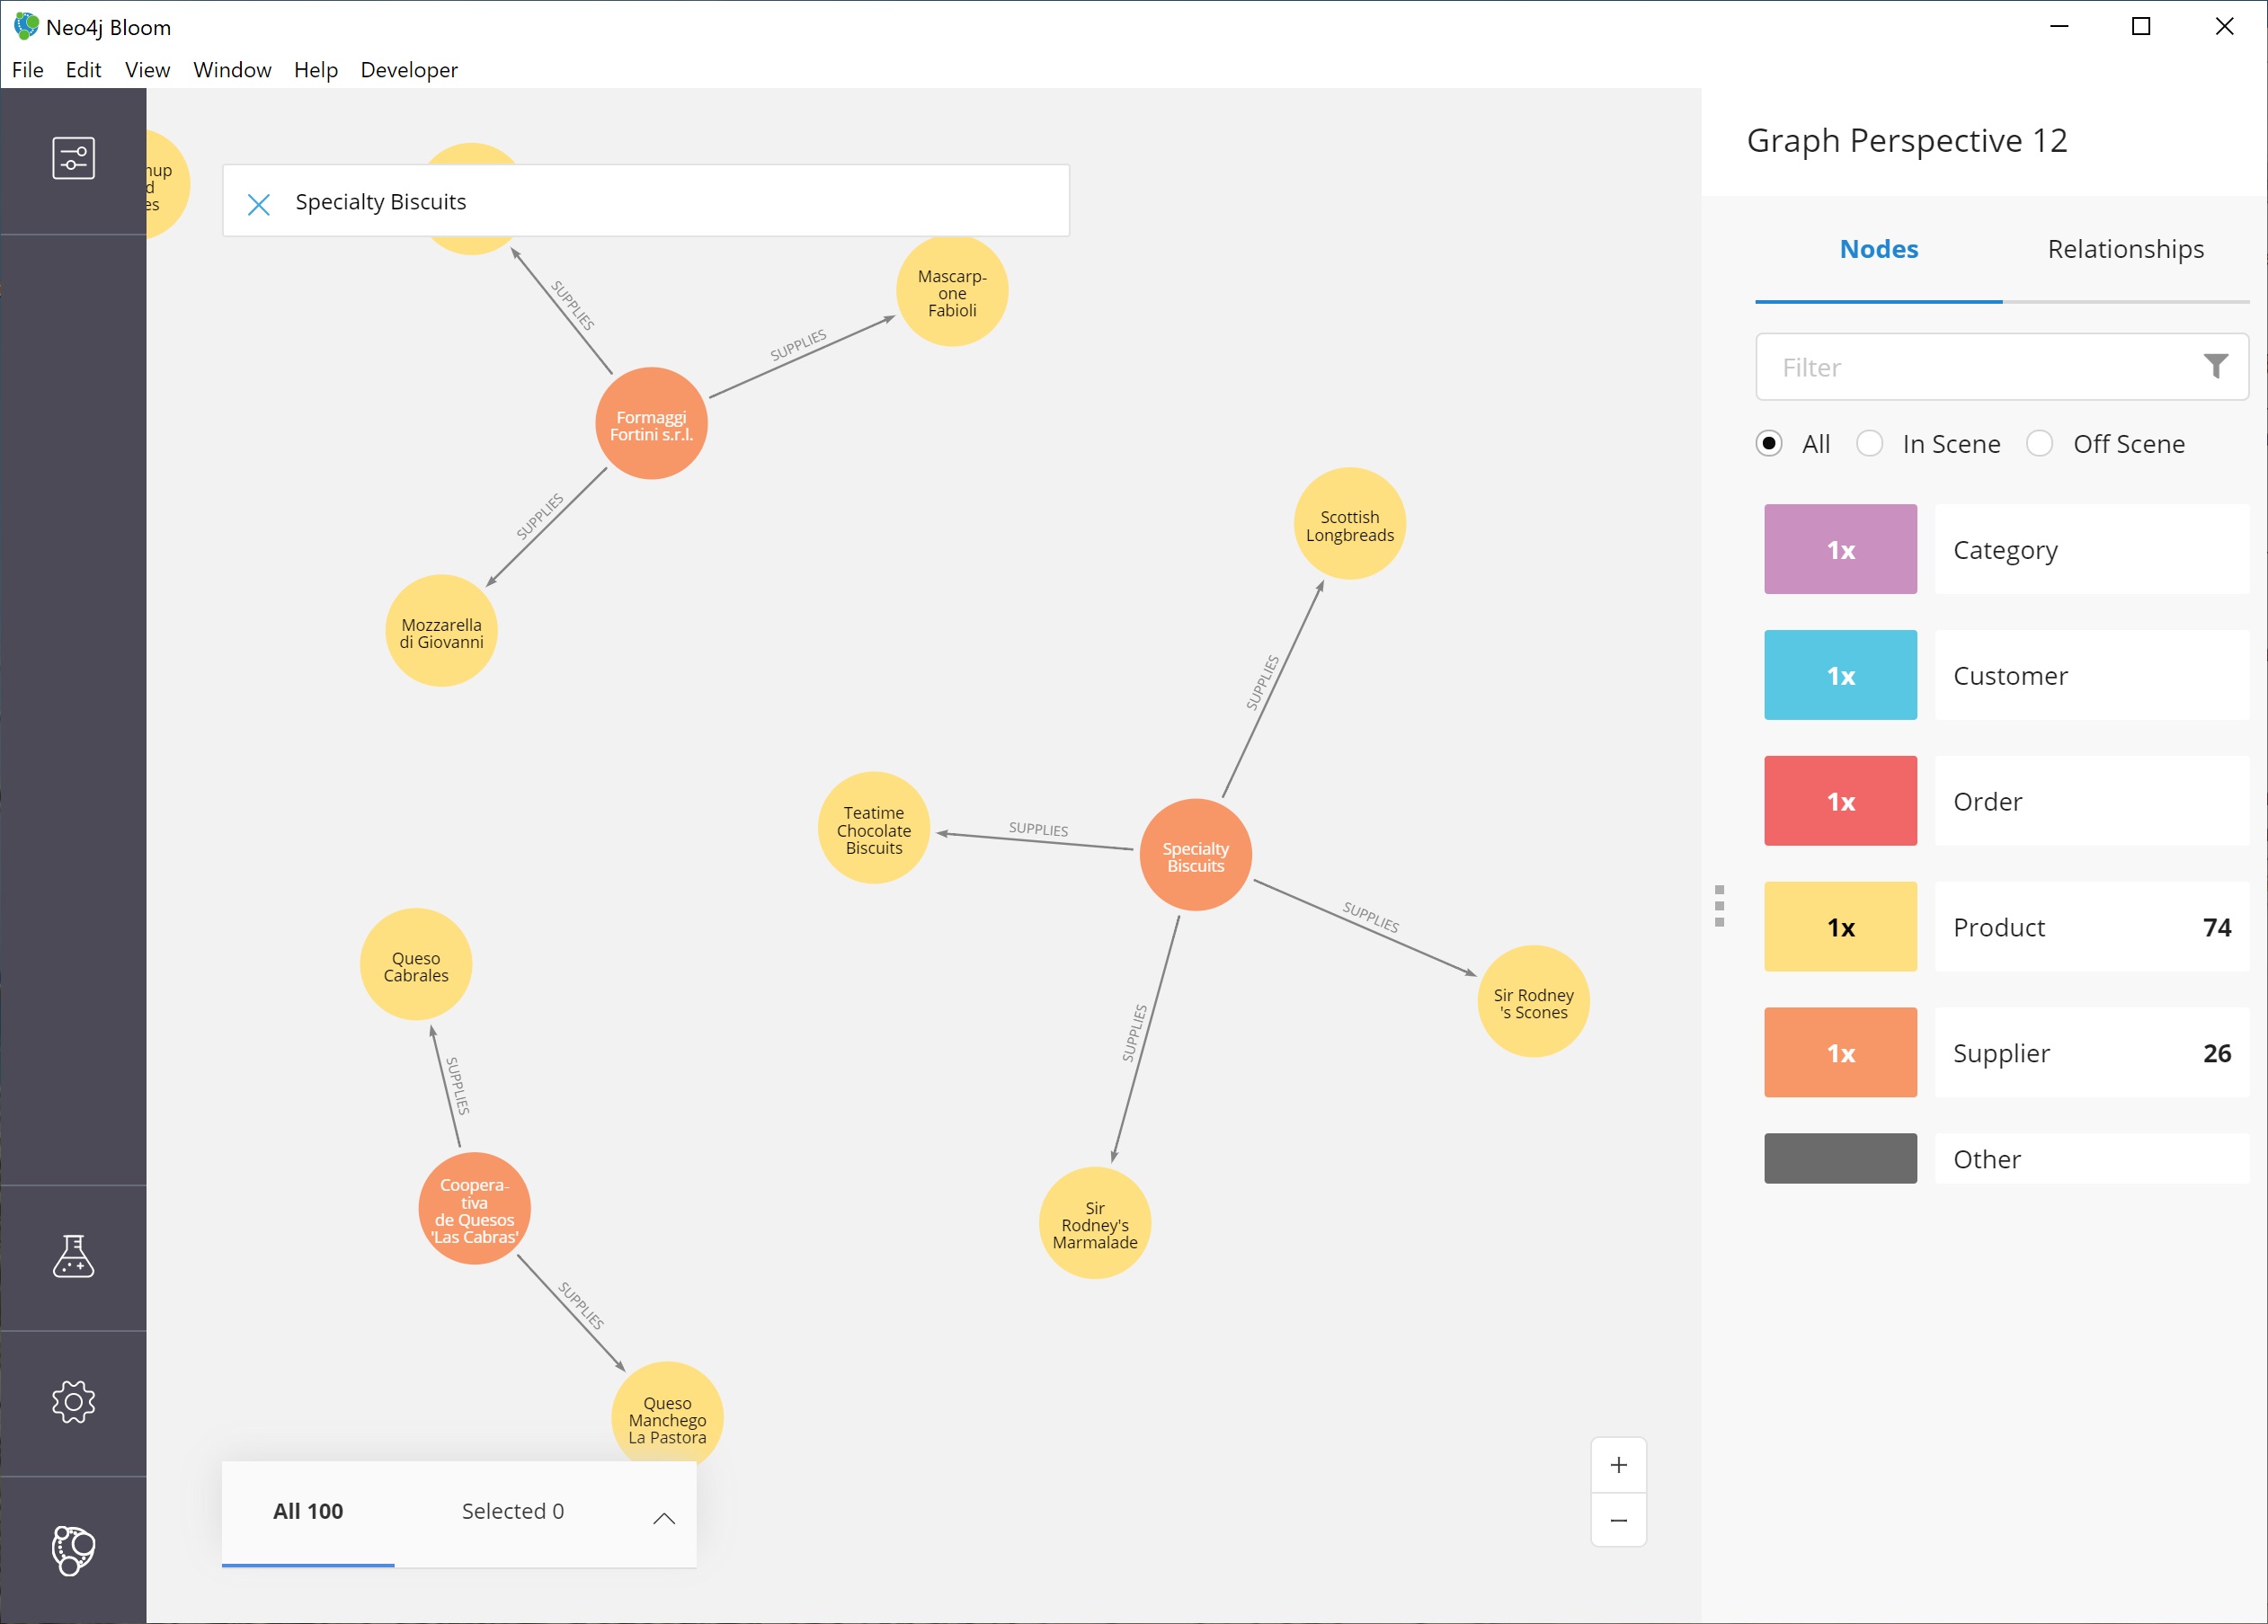
Feel free to explore others, as well, such as the suppliers Pavlova and New Orleans Cajun Delights.
Finding customers who ordered two specific products
Let us see if we can find one more complex pattern for finding customers who have ordered two different products.
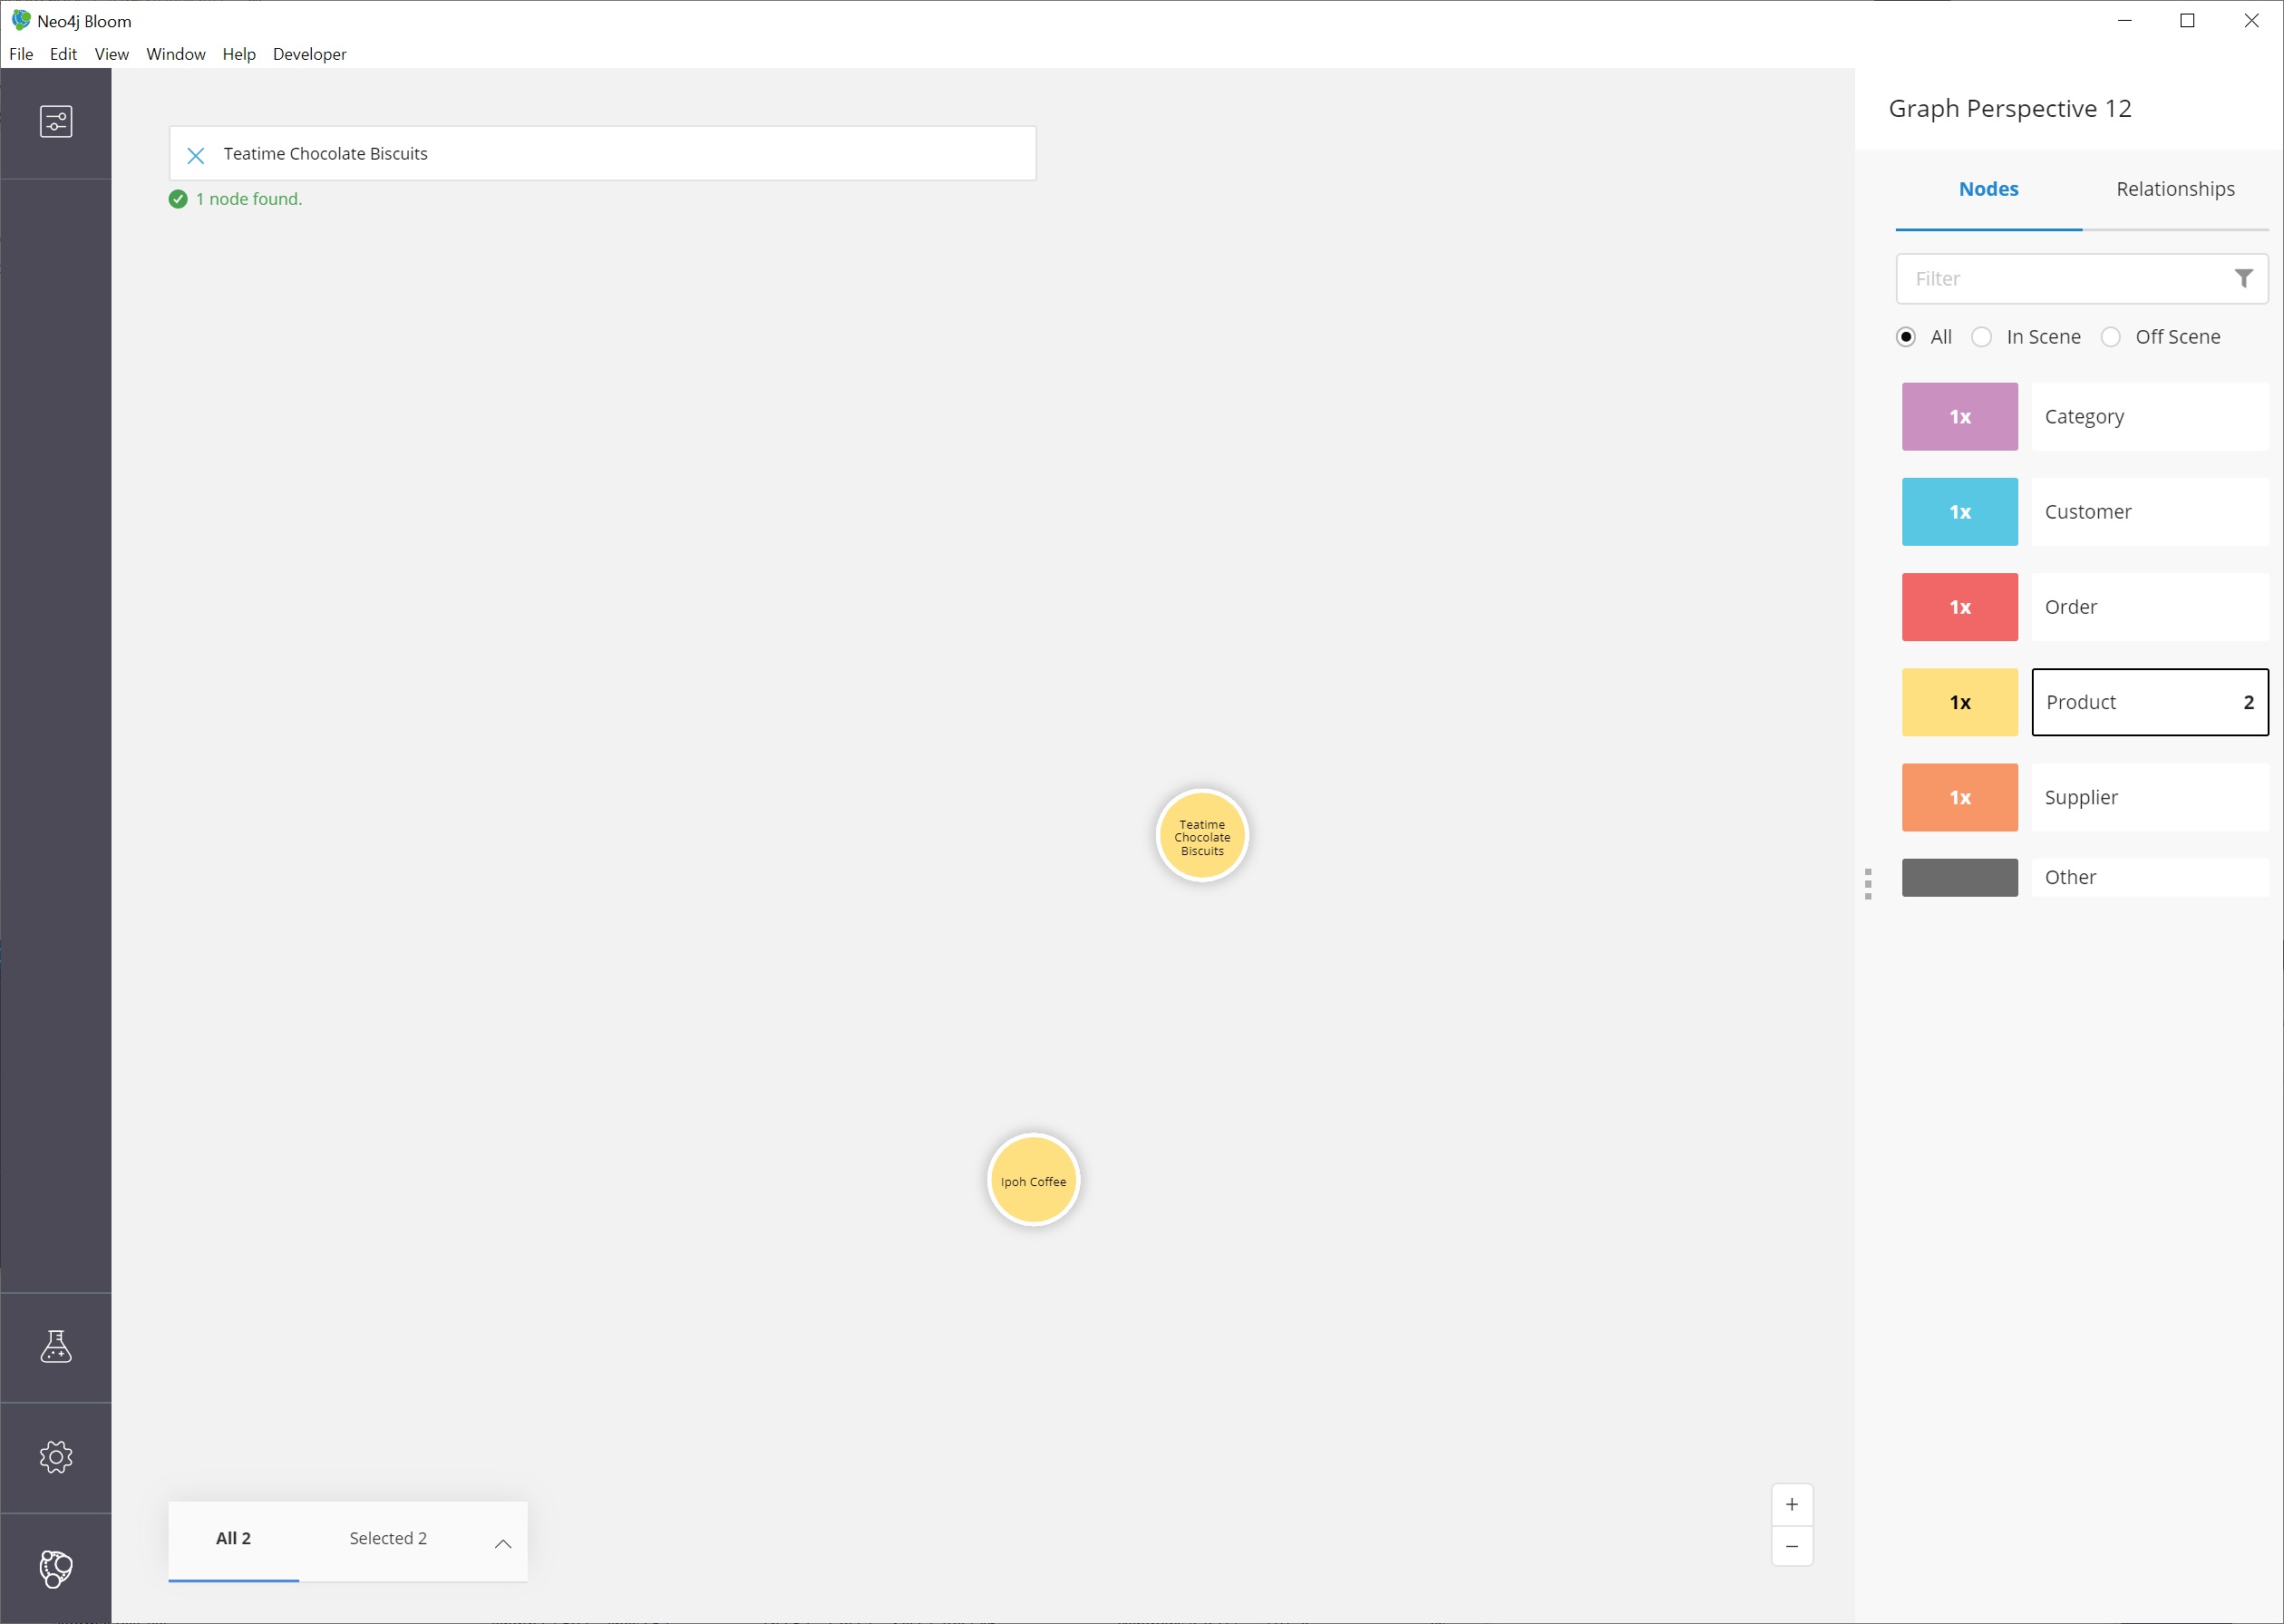
We can choose anything, but let’s start with the products Ipoh Coffee and Teatime Chocolate Biscuits.
For this type of query, we can use Bloom’s capability of searching indexed properties to shorten our syntax.
Instead of searching for a product node with a particular property and value, we can type in the indexed property value, and Bloom will find the related node category.
Just typing Ipoh Coffee can also do a full-text search
This is the search we can use to answer our question.
Teatime Chocolate Biscuits Order Customer Order Ipoh Coffee
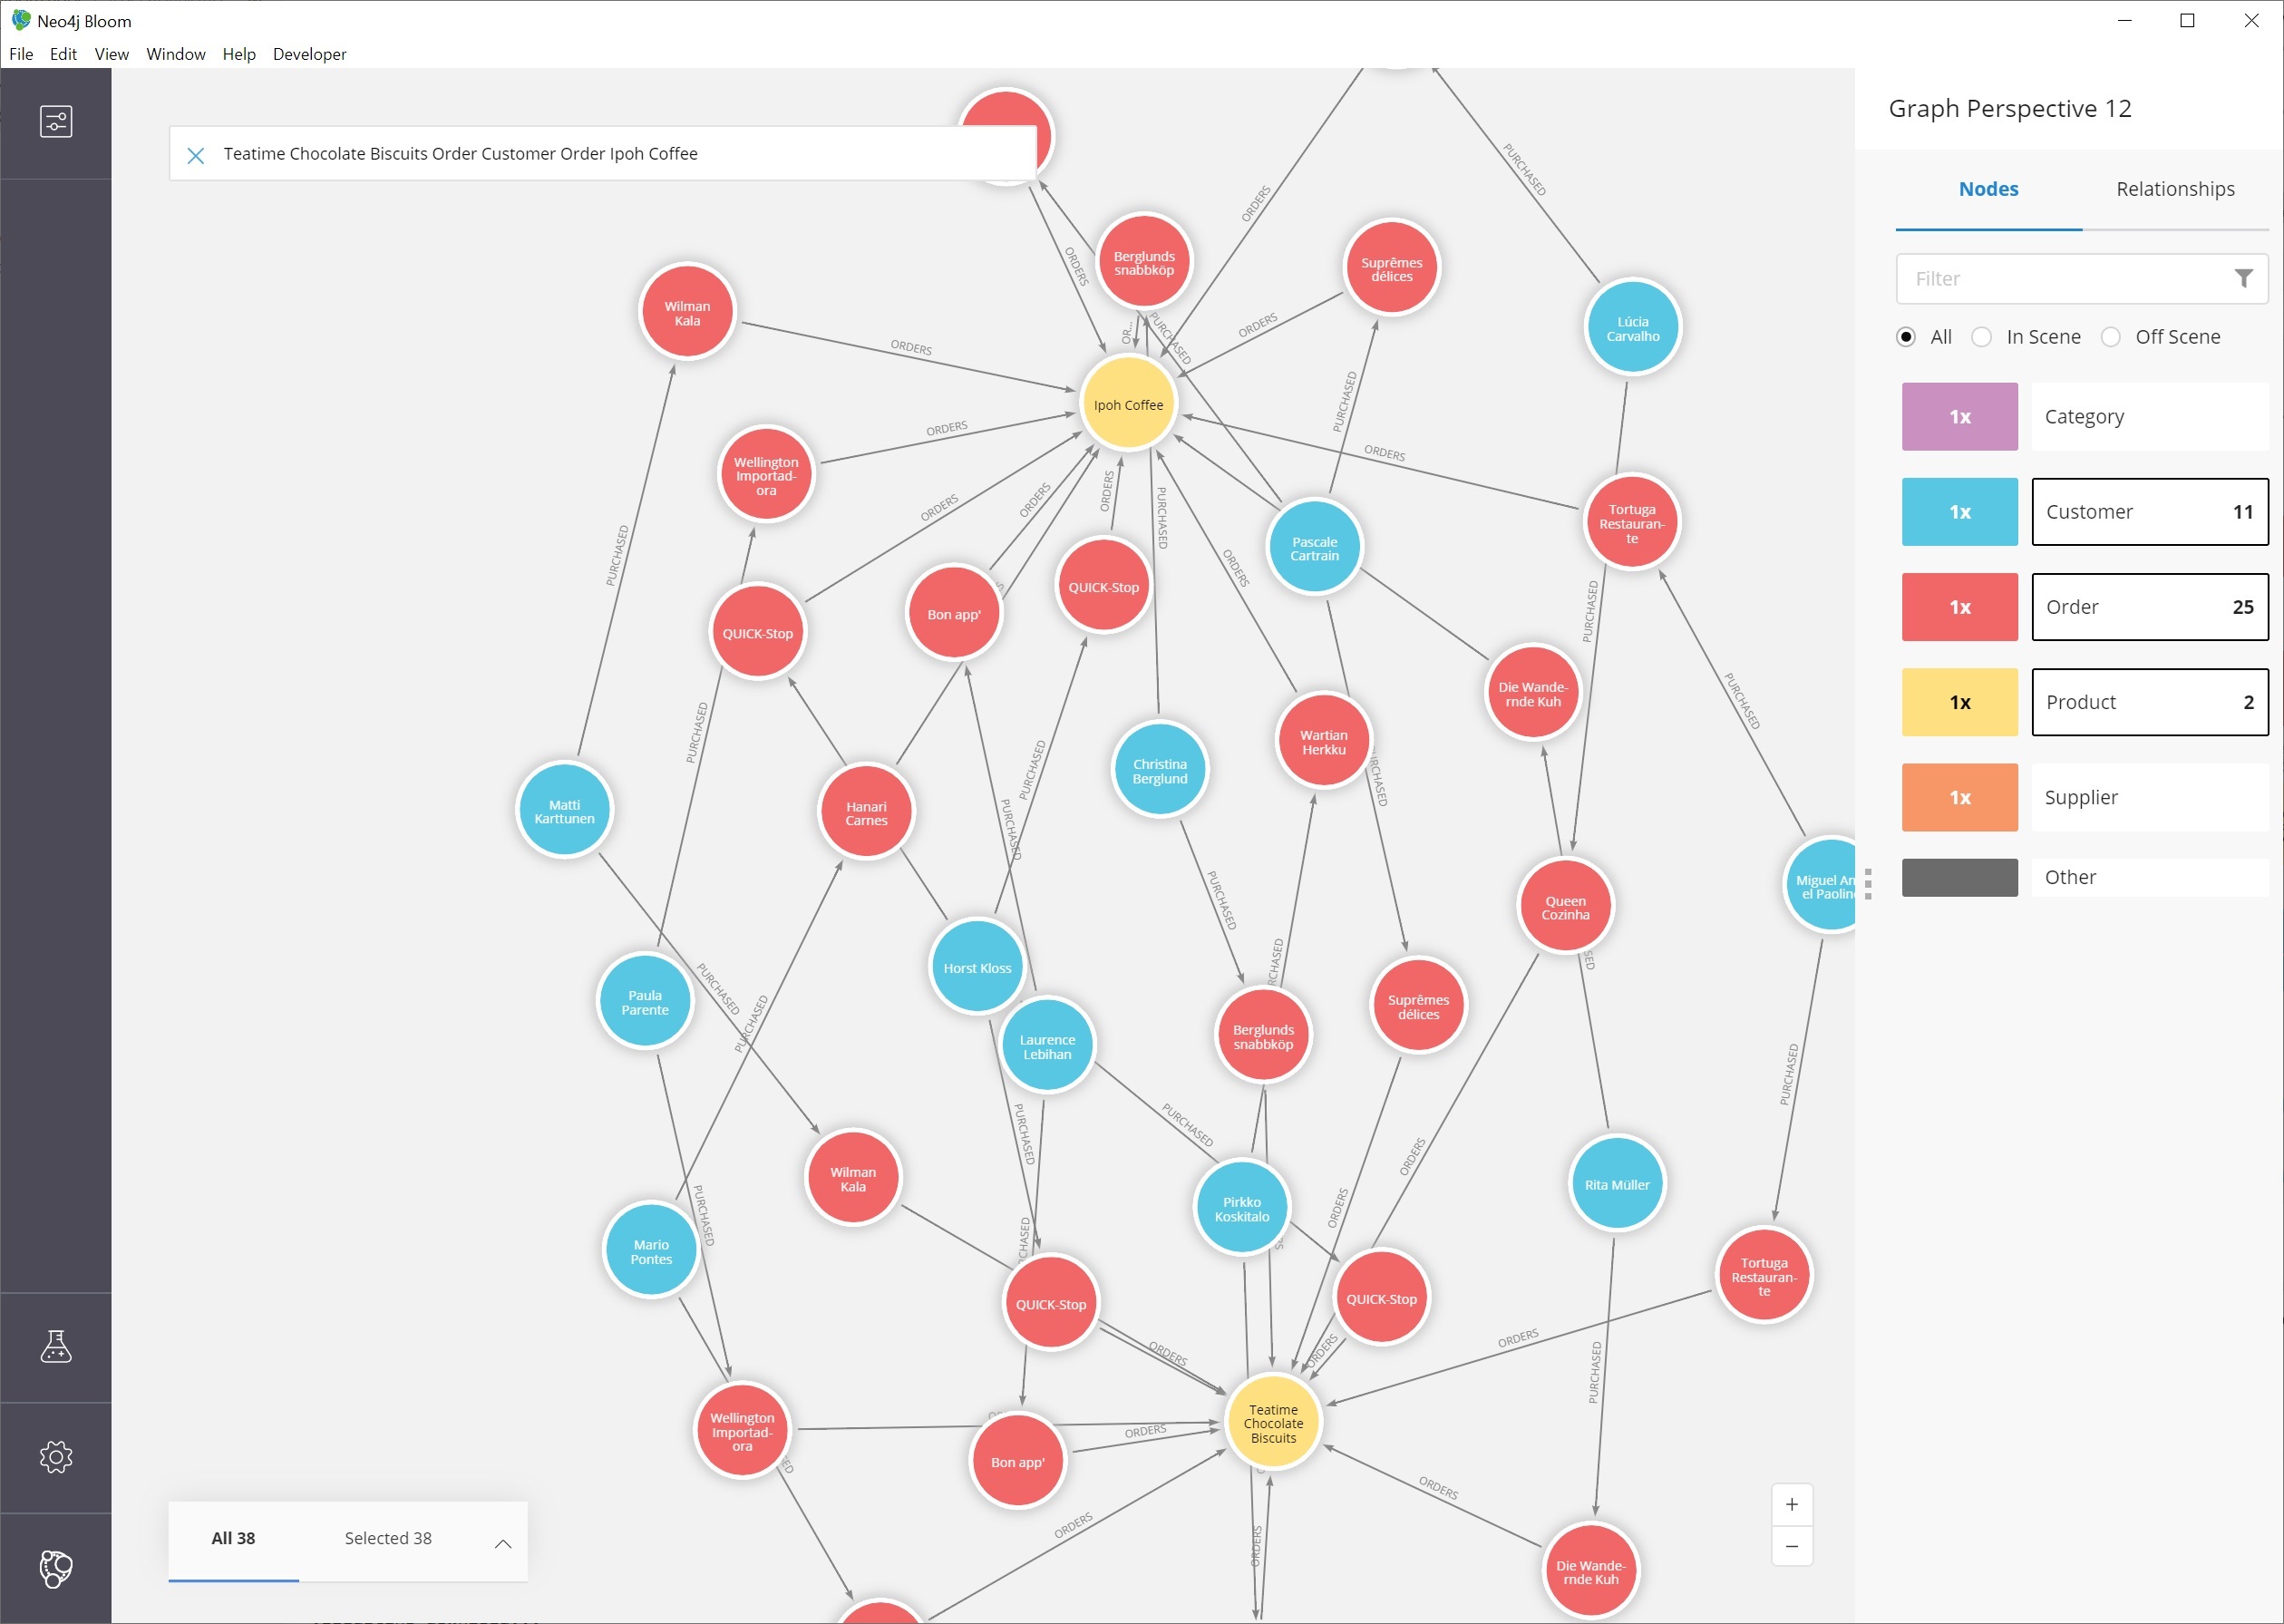
All of the customer nodes (in blue) are those who have ordered both the coffee and chocolate biscuits products. We can dig into the different customers to find out more information about who is purchasing them. For instance, only one customer is in North America (Tortuga Restaurante in Mexico) - all others are South America or Europe.
Finding the shortest path between two products
Let us continue searching for more information on our two products - Ipoh Coffee and Teatime Chocolate Biscuits - by finding the shortest path in the graph from one to the other.
The shortest path will search the graph to find the fewest number of hops from the start node to the destination node.
To do this, we need to search and retrieve the two nodes in our scene.
|
Walkthrough Steps…
First, clear the scene.
Then, search for one product and press |
Once the coffee and chocolate biscuit products are in our scene, we can select both products (click on product1 + ctrl/cmd key + click on product2).
This should highlight both products by placing a white border around each one of them.
Now, we need to find the shortest path between them.
We can right-mouse click (keyboard:`ctrl/cmd key + click`) on either of the selected nodes and choose the Path option that expands into a submenu.
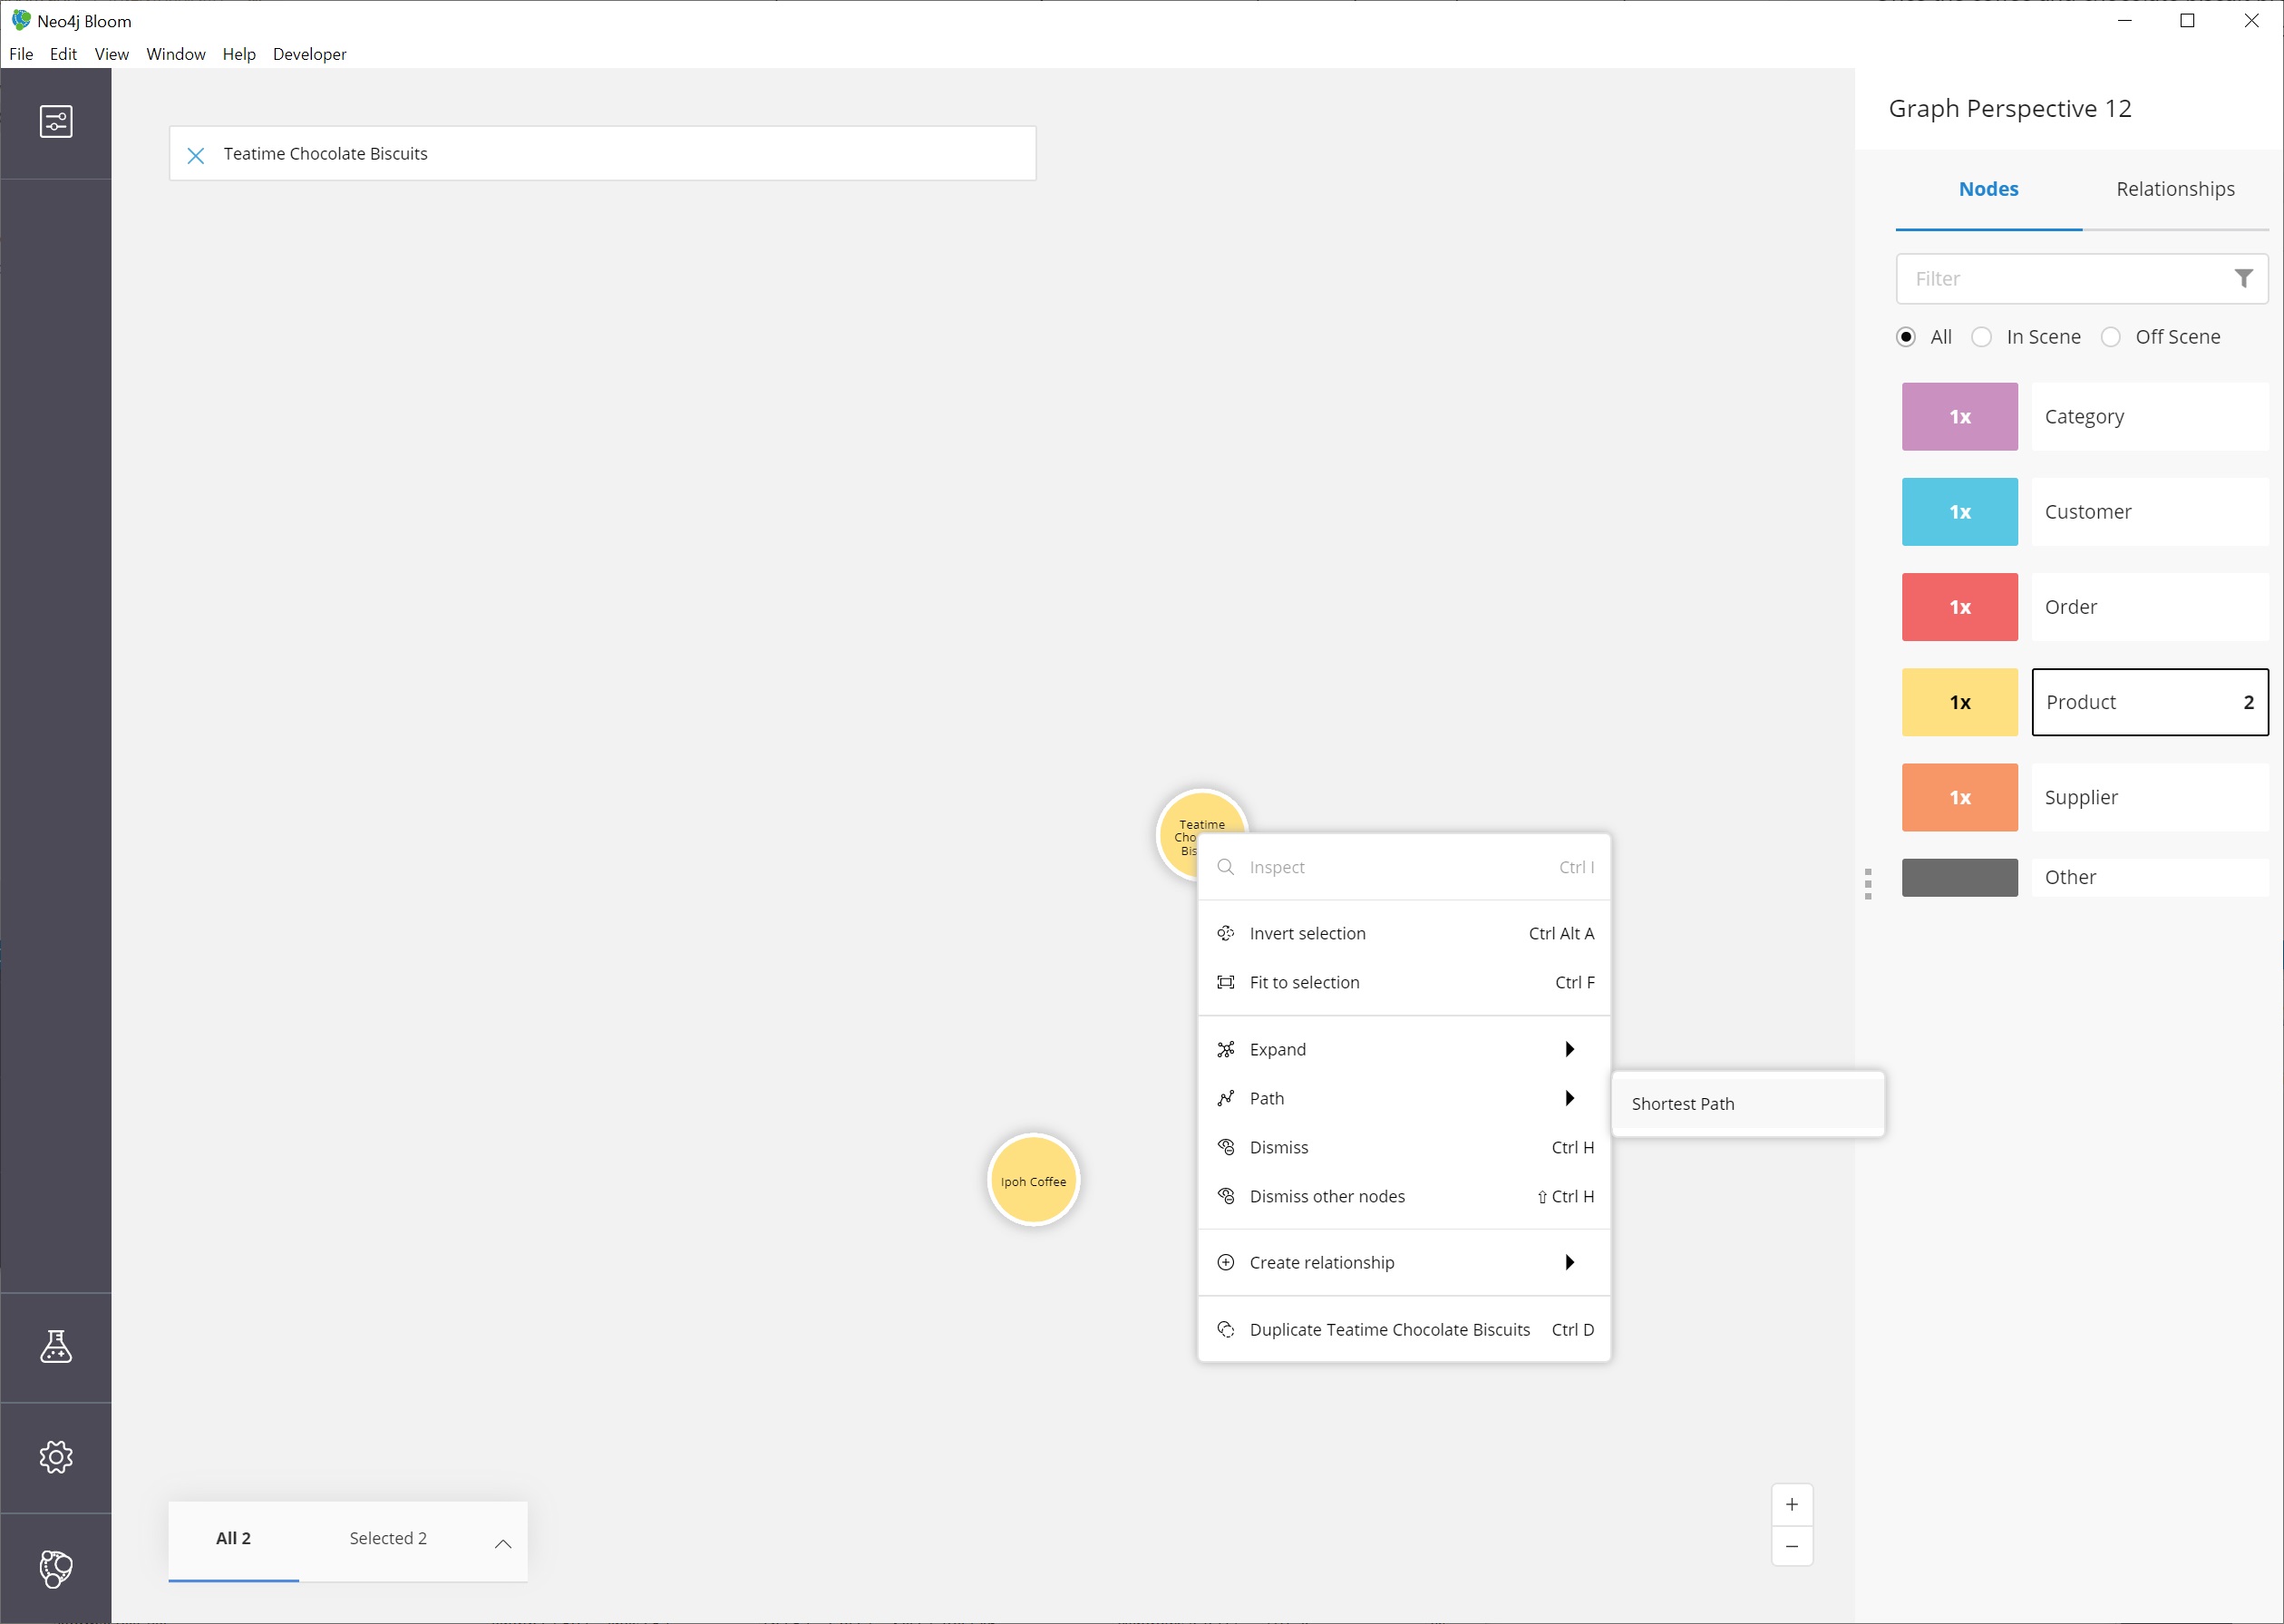
Click on Shortest path to choose and run it.
This gives us the results for the fewest number of hops between the Teatime Chocolate Biscuits product and the Ipoh Coffee product.
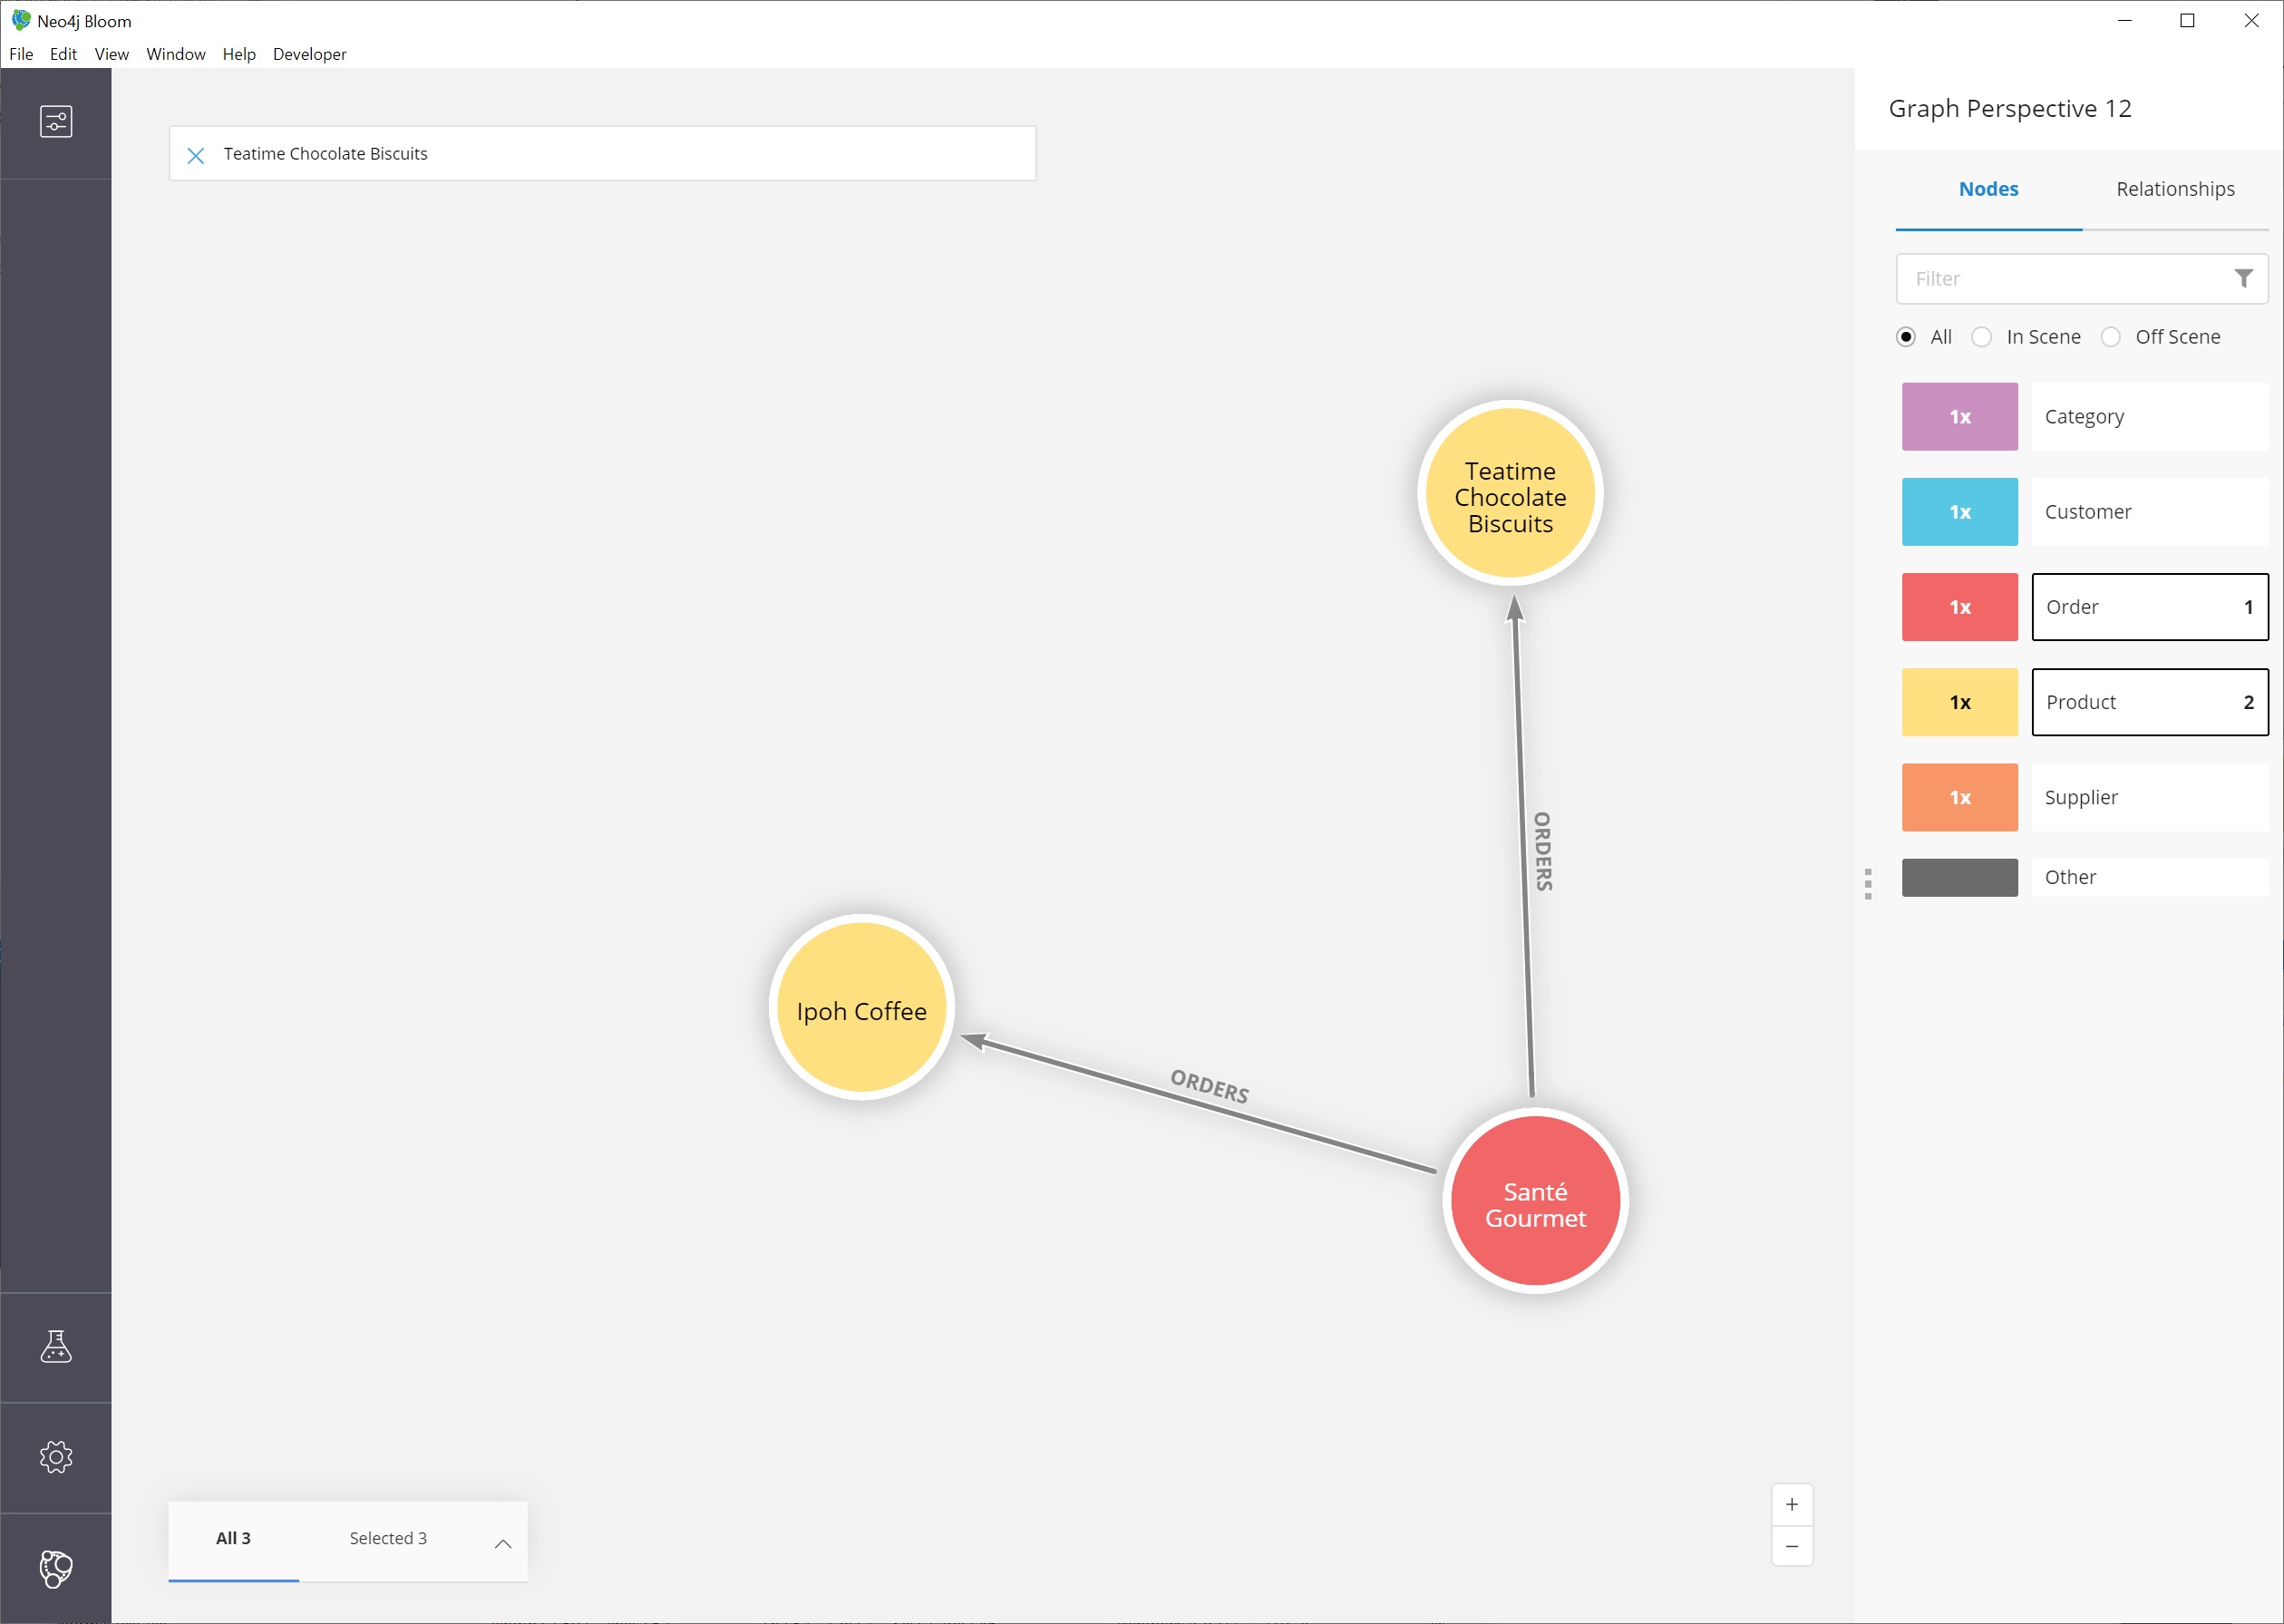
In this case, it looks like there is an Order node that includes both products.
Wrapping up
In this guide, we walked through navigating and exploring graph data with Neo4j Bloom. We saw how to set up Neo4j Bloom for our environment and create (as well as alter) perspectives for viewing the data. To explore data and analyze results, we used the search bar to find nodes with a certain label, patterns for product suppliers, and specific patterns for particular products. Finally, we learned how to use the option menus and selection within the scene to dismiss miscellaneous nodes, clear the scene, and find shortest paths between nodes.
There are many more things to learn and explore with this tool, so check out the resources listed below to continue the journey.
Resources
-
Documentation: Learn more about Neo4j Bloom
-
Product page: About Bloom
-
Video Series: See how to use capabilities in Bloom in the YouTube series
-
YouTube video: Bloom Tips and Tricks
-
Community Site: Ask questions and assist others in the Neo4j Bloom topic