Dashboards
Neo4j Enterprise Studio has three tools built in, Query, Bloom, and Dashboards.
Dashboards help you present your data through visualizations such as tables, bar charts, and more. Graph visualization helps you understand, explore, analyze, and make decisions based on data.
The Dashboards experience in Enterprise Studio is closely aligned with the Neo4j Aura console, but note that AI generated dashboards and online sharing is only available in Aura.
In Enterprise Studio, you can find Dashboards in the left sidebar, under Tools.
Select your Neo4j deployment via the dropdown and select your database from the database dropdown. Once connected, your data is available and you can create new dashboards or display your existing ones.
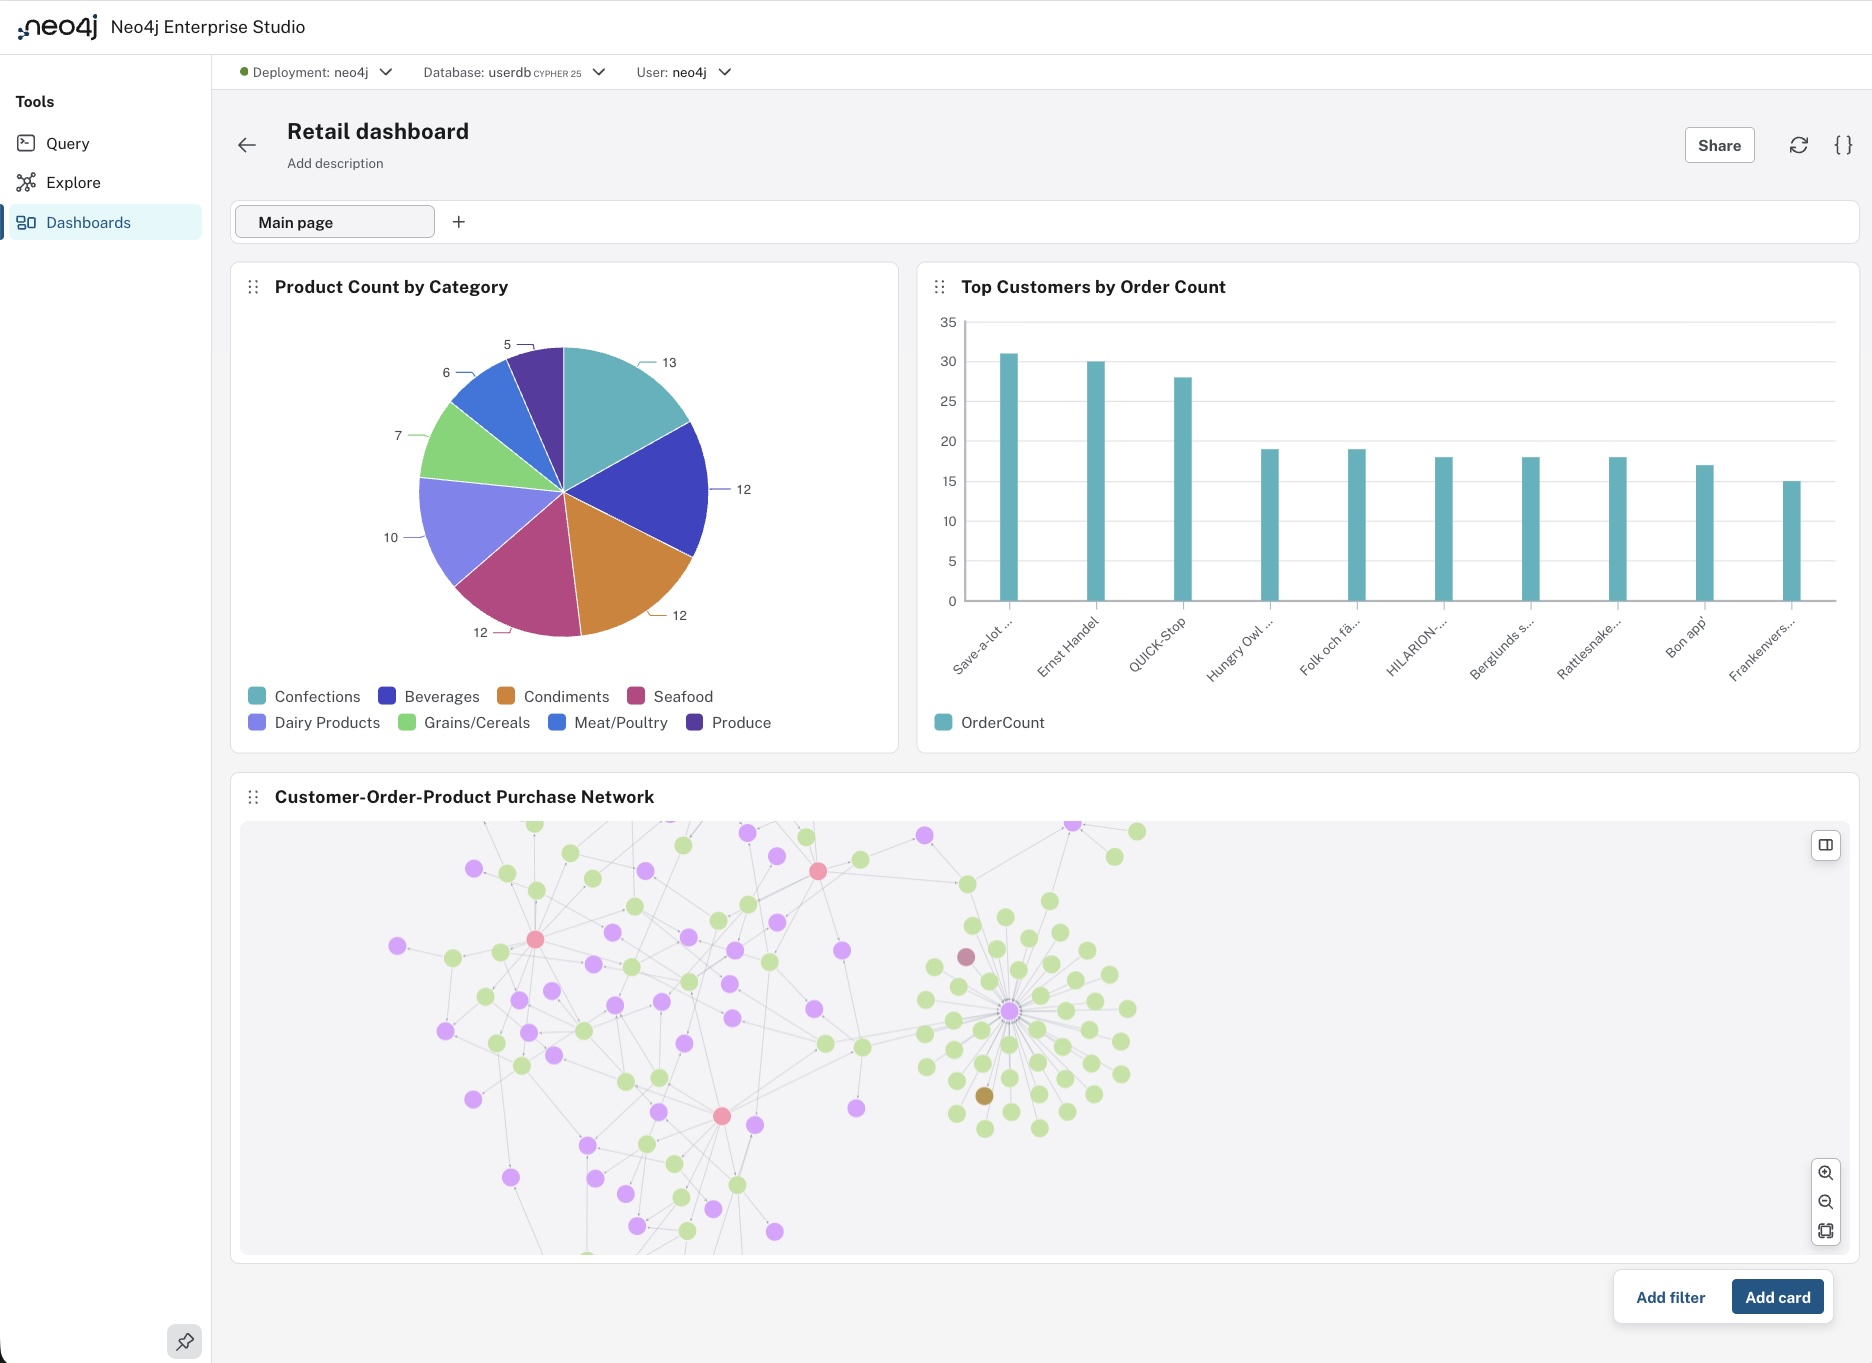
The UI consists of cards, each based on a Cypher® query, which create an interactive dashboard.
Dashboard cards
Each visualization is interactive: you can hover, drag, and customize each chart in depth. They are described in detail with Cypher examples in Aura documentation → Visualizations.
Use the Add card button in the bottom right of the dashboard UI to create a new visualization.
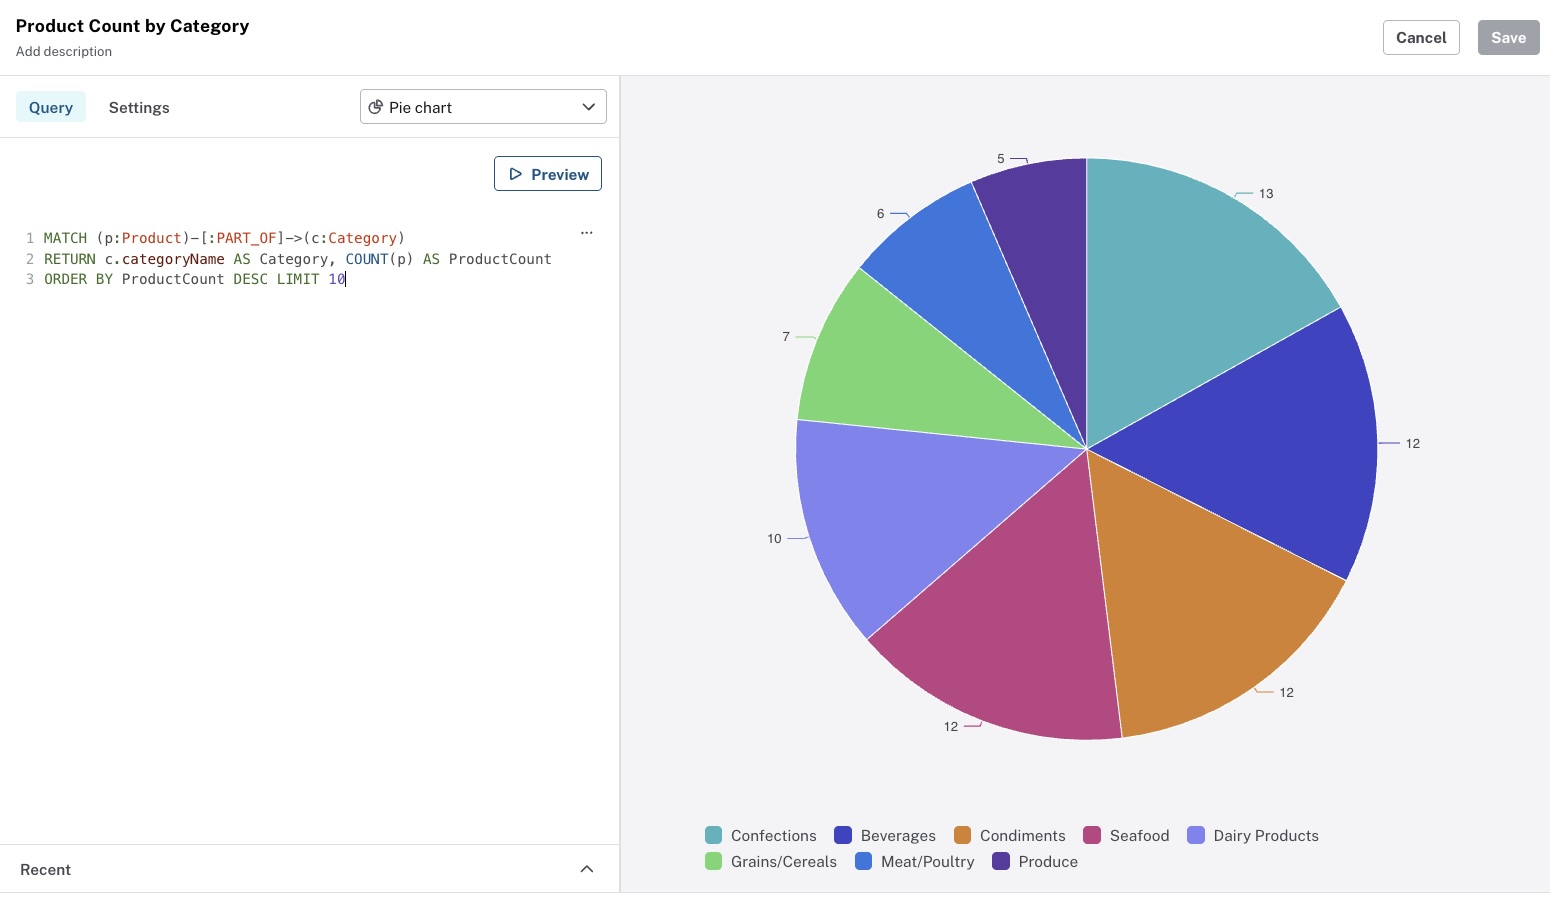
Query (left): The left pane provides a Cypher editor with syntax highlighting. Enter or modify a query and use Preview to run it against the connected database.
Preview (right): Choose how you want to visualize the data from the top right dropdown (e.g. pie chart, table etc.) The right pane displays the query output as a visualization.
Share dashboards
The sharing dashboards experience differs a little between Enterprise Studio and the Aura console. In Enterprise Studio you can share a dashboard with a specified database role, OR you can share with other users of the database by their username. Use the Share button in the upper right corner to start the process.
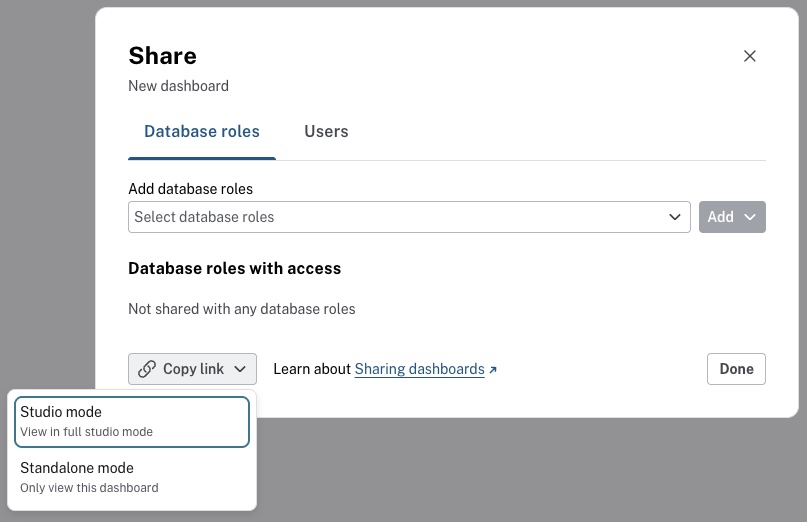
The roles or users you share a dashboard with will see it in their Dashboards tool once they have been added. However, you can also share a link with them that takes them directly to the dashboard in question. There are two options to do this. You can either share a link to the Studio mode that will take them to the dashboard in their Enterprise Studio, or you can share in standalone mode which will allow them to see only that dashboard without any access to the rest of Enterprise Studio.
If you want to revoke access from a role or user, you can do that from the same dialog, accessed via the Share button.
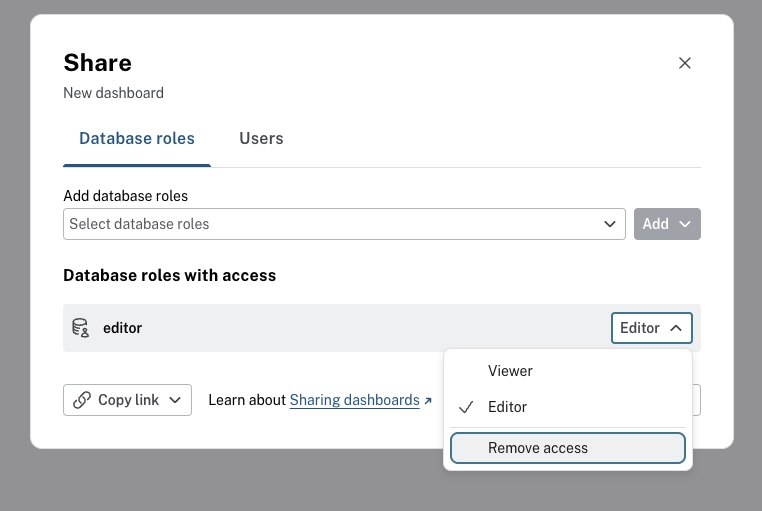
For more details on how sharing works in Dashboards, see Aura → Sharing dashboards.
Export dashboards
Export your dashboards as JSON for reuse or sharing. This lets you move dashboards or share them offline.
Filters
Filters make dashboard charts dynamic. Filters let you control parameters without editing Cypher. To use a filter, you should define parameters and once a parameter is defined, it appears in the Dashboard UI and updates all linked cards when the parameter is changed.
Parameters
Parameters are associated with a specific dashboard.
Each parameter has a value and type both of which you can set initially as a default.
Access the parameters of a dashboard by using the parameters button {} to show the parameters drawer.
Text
You can also use text to write notes on your dashboard. Use text to explain the charts, dataset, or describe how to use the interactive features like filters.
For more information and examples, see: Aura documentation → Dashboards.
Migration
To migrate dashboards from NeoDash or Neo4j Desktop, see Administration → Migration to Enterprise Studio.